Median price of real estate
in the municipality of Chépy
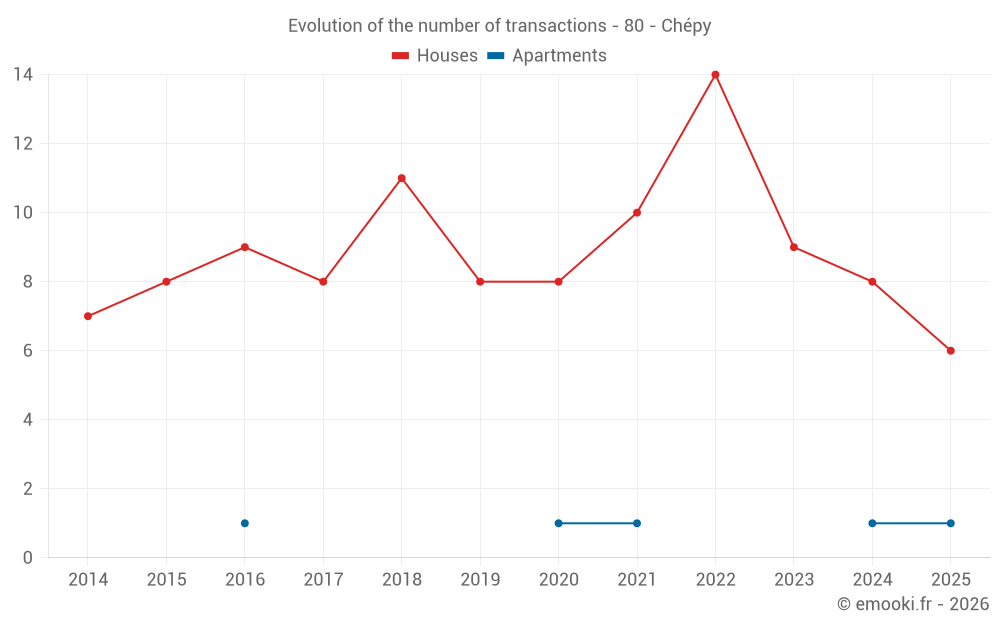
Houses
1 718 € /m²
Reliability 7/10
Median price on the 16 transactions of the last 24 months.
from 1 130 to
1 969 € /m²
1 969 € /m²
60% of transactions from the 2nd to the 8th deciles.
Apartments
1 220 € /m²
Reliability 2/10
Median price on the 4 transactions of the last 96 months.
Dwellings
1 544 € /m²
Reliability 7/10
Median price on the 18 transactions of the last 24 months.
from 1 162 to
1 931 € /m²
1 931 € /m²
60% of transactions from the 2nd to the 8th deciles.