emooki
HomePrice mapTransactions
🇬🇧 English🇫🇷 Français🇩🇪 Deutsch🇪🇸 Español🇮🇹 Italiano

Real estate price map


Real estate price map in the municipality of Quend.

Somme (80)
Quend

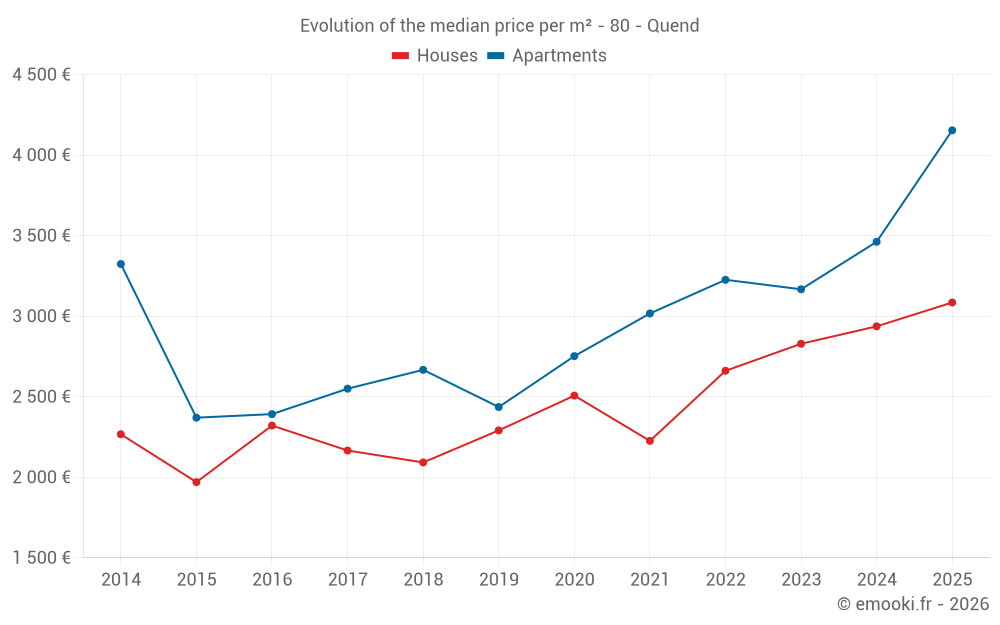
Median price of real estate
in the municipality of Quend

HousesHouses
2 989 € /m²
1-23-45-67-89-10
Reliability 8/10
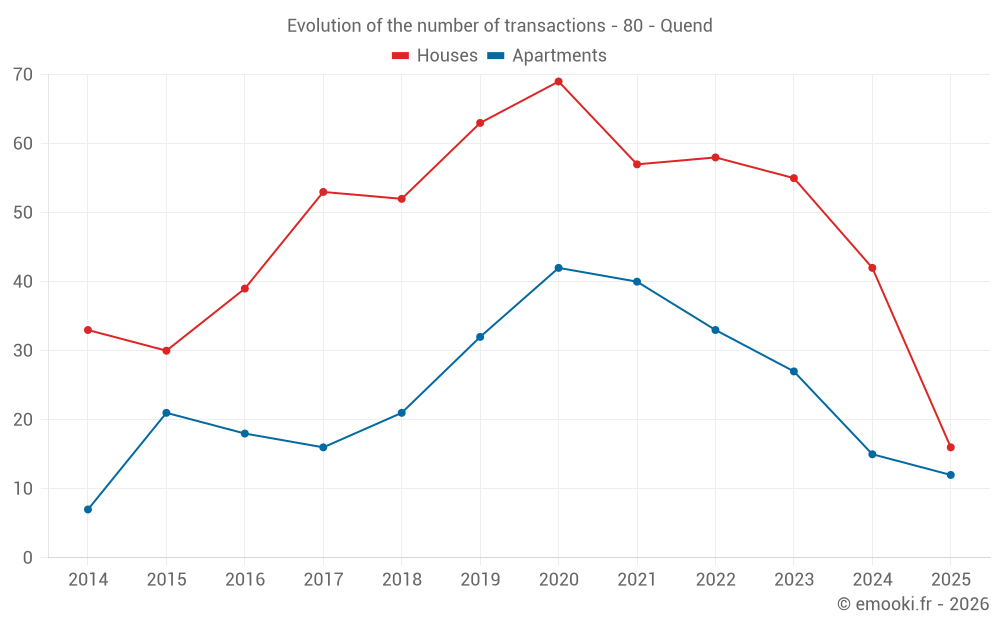
Median price on the 40 transactions of the last 12 months.
from 2 334 to
3 943 € /m²
60% of transactions from the 2nd to the 8th deciles.
ApartmentsApartments
3 905 € /m²
1-23-45-67-89-10
Reliability 8/10
Median price on the 21 transactions of the last 12 months.
from 3 377 to
4 375 € /m²
60% of transactions from the 2nd to the 8th deciles.
DwellingsDwellings
3 864 € /m²
1-23-45-67-89-10
Reliability 9/10
Median price on the 28 transactions of the last 6 months.
from 2 709 to
4 880 € /m²
60% of transactions from the 2nd to the 8th deciles.
HousesEvolution of the price per m² of houses since...
1 year
+5%
2 years
+9%
3 years
+16%
4 years
+39%
5 years
+23%
6 years
+35%
7 years
+47%
8 years
+42%
9 years
+33%
10 years
+57%
11 years
+36%
ApartmentsEvolution of the price per m² of apartments since...
1 year
+20%
2 years
+31%
3 years
+29%
4 years
+38%
5 years
+51%
6 years
+71%
7 years
+56%
8 years
+63%
9 years
+74%
10 years
+75%
11 years
+25%

Yearly evolution

Evolution of the median price per m²

Evolution of the number of transactions

Warning, last year incomplete. Projections made based on the proportions between semesters of the previous year at the departmental/national level and by type of property.

Yearly data

Descending order
Year
Houses
house
transactions
Houses
house
Price per m²
Apartments
apt.
transactions
Apartments
apt.
Price per m²
2025
16
3 085 €
12
4 154 €
2024
42
2 937 €
15
3 462 €
2023
55
2 829 €
27
3 167 €
2022
58
2 661 €
33
3 226 €
2021
57
2 226 €
40
3 017 €
2020
69
2 507 €
42
2 752 €
2019
63
2 291 €
32
2 436 €
2018
52
2 092 €
21
2 667 €
2017
53
2 166 €
16
2 550 €
2016
39
2 321 €
18
2 392 €
2015
30
1 970 €
21
2 370 €
2014
33
2 267 €
7
3 324 €

Analysis

Structure of prices per m²

Values of price percentiles per m² over the periods used for the estimated price of each type of property.

Structure of transaction amounts

Values of transaction amounts percentiles over the periods used for the estimated price of each type of property.

Transaction amounts and prices per m² by percentile

Ascending order
Percentile
Houses
house
Price per m²
Houses
house
Transaction amount
Apartments
apt.
Price per m²
Apartments
apt.
Transaction amount
10th percentile
1 799 €
86 340 €
3 103 €
78 500 €
20th percentile
2 334 €
119 K€
3 377 €
90 000 €
30th percentile
2 631 €
155 K€
3 486 €
105 K€
40th percentile
2 818 €
187 K€
3 824 €
120 K€
50th percentile
2 989 €
227 K€
3 905 €
129 K€
60th percentile
3 269 €
241 K€
4 063 €
140 K€
70th percentile
3 582 €
288 K€
4 257 €
158 K€
80th percentile
3 943 €
331 K€
4 375 €
164 K€
90th percentile
4 730 €
375 K€
5 132 €
174 K€

National and departmental comparison

Evolution of the median price per m² of houses

Evolution of the median price per m² of apartments

Quarterly evolution

Evolution of the median price per m²

Evolution of the number of transactions

Quarterly data

Descending order
Quarter
Houses
house
transactions
Houses
house
Price per m²
Apartments
apt.
transactions
Apartments
apt.
Price per m²
2025 Q2
5
3 289 €
10
4 154 €
2025 Q1
11
2 978 €
2
4 082 €
2024 Q4
9
2 400 €
6
3 138 €
2024 Q3
15
3 444 €
3
4 031 €
2024 Q2
9
2 654 €
3
3 462 €
2024 Q1
9
2 697 €
3
3 518 €
2023 Q4
6
2 241 €
7
3 591 €
2023 Q3
16
2 652 €
8
2 784 €
2023 Q2
17
2 799 €
6
3 066 €
2023 Q1
16
3 334 €
6
3 220 €
2022 Q4
17
2 639 €
8
3 086 €
2022 Q3
11
3 286 €
7
3 297 €
2022 Q2
14
3 029 €
8
2 854 €
2022 Q1
16
2 270 €
10
3 376 €
2021 Q4
15
2 651 €
6
3 135 €
2021 Q3
12
2 352 €
12
2 994 €
2021 Q2
15
2 570 €
13
2 808 €
2021 Q1
15
1 667 €
9
2 949 €
2020 Q4
24
2 276 €
20
3 076 €
2020 Q3
11
2 589 €
12
2 741 €
2020 Q2
16
2 392 €
3
2 423 €
2020 Q1
18
2 810 €
7
2 372 €
2019 Q4
13
2 031 €
9
2 656 €
2019 Q3
16
2 274 €
8
2 099 €
2019 Q2
18
2 396 €
3
2 727 €
2019 Q1
16
2 387 €
12
2 333 €
2018 Q4
10
1 933 €
7
2 667 €
2018 Q3
17
2 037 €
3
3 580 €
2018 Q2
15
2 222 €
9
2 261 €
2018 Q1
10
2 247 €
2
2 532 €
2017 Q4
19
1 971 €
7
2 938 €
2017 Q3
15
2 836 €
2
3 558 €
2017 Q2
11
2 325 €
4
2 273 €
2017 Q1
8
1 786 €
3
2 425 €
2016 Q4
14
2 286 €
7
2 446 €
2016 Q3
8
2 404 €
3
2 807 €
2016 Q2
14
2 386 €
5
2 311 €
2016 Q1
3
1 625 €
3
1 200 €
2015 Q4
11
2 011 €
10
2 421 €
2015 Q3
11
2 192 €
2
2 640 €
2015 Q2
1
2 946 €
2
2 592 €
2015 Q1
7
1 768 €
7
2 014 €
2014 Q4
9
1 868 €
2
2 517 €
2014 Q3
10
2 275 €
2
3 570 €
2014 Q2
6
2 496 €
1
1 500 €
2014 Q1
8
2 599 €
2
4 174 €

Somme (80)

Most expensive cities

City
name
Descending orderHouses
house
Price per m²
4 258 €
3 742 €
3 474 €
3 280 €
3 012 €
2 989 €
2 986 €
2 713 €
2 600 €
2 529 €
City
name
Descending orderApartments
apt.
Price per m²
8 100 €
5 334 €
4 556 €
4 178 €
3 964 €
3 905 €
3 582 €
3 144 €
2 768 €
2 635 €

Least expensive cities

City
name
Ascending orderHouses
house
Price per m²
402 €
486 €
500 €
598 €
625 €
663 €
673 €
693 €
702 €
City
name
Ascending orderApartments
apt.
Price per m²
161 €
169 €
273 €
286 €
331 €
355 €
366 €
428 €