emooki
SearchPrice mapTransactions
🇬🇧 English🇫🇷 Français🇩🇪 Deutsch🇪🇸 Español🇮🇹 Italiano

Real estate price map


Real estate price map in the municipality of Buc.

Yvelines (78)
Buc

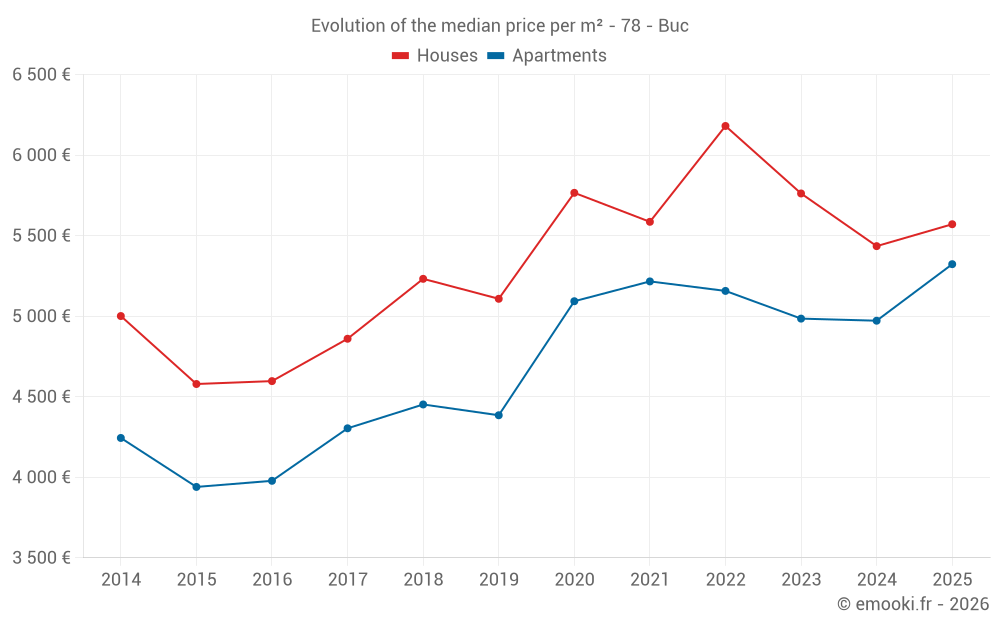
Median price of real estate
in the municipality of Buc

HousesHouses
5 454 € /m²
1-23-45-67-89-10
Reliability 8/10
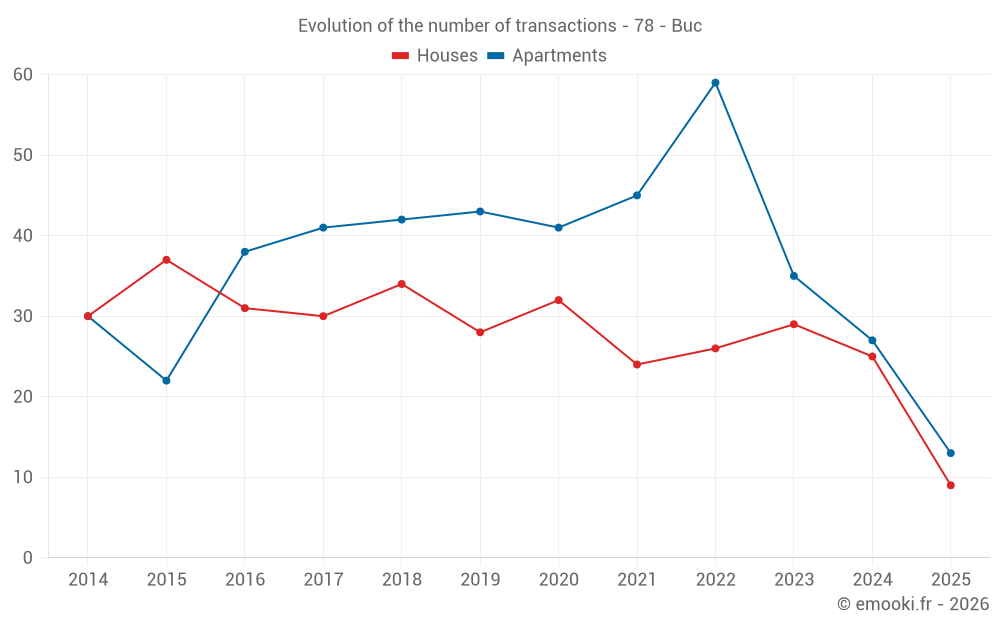
Median price on the 24 transactions of the last 12 months.
from 5 029 to
5 989 € /m²
60% of transactions from the 2nd to the 8th deciles.
ApartmentsApartments
5 056 € /m²
1-23-45-67-89-10
Reliability 8/10
Median price on the 27 transactions of the last 12 months.
from 4 337 to
5 533 € /m²
60% of transactions from the 2nd to the 8th deciles.
DwellingsDwellings
5 388 € /m²
1-23-45-67-89-10
Reliability 9/10
Median price on the 22 transactions of the last 6 months.
from 4 744 to
5 803 € /m²
60% of transactions from the 2nd to the 8th deciles.
HousesEvolution of the price per m² of houses
1 year
+2.5%
2 years
-3.3%
3 years
-9.9%
4 years
-0.3%
5 years
-3.4%
6 years
+9.1%
7 years
+6.5%
8 years
+14.6%
9 years
+21.2%
10 years
+21.7%
11 years
+11.4%
ApartmentsEvolution of the price per m² of apartments
1 year
+7.1%
2 years
+6.8%
3 years
+3.2%
4 years
+2.1%
5 years
+4.5%
6 years
+21.4%
7 years
+19.6%
8 years
+23.7%
9 years
+33.8%
10 years
+35.1%
11 years
+25.4%

Yearly evolution

Median price per m²

Number of transactions

Warning, last year incomplete. Projections made based on the proportions between semesters of the previous year at the departmental/national level and by type of property.

Yearly data

Descending order
Year
Houses
house
Price per m²
Houses
house
transactions
Apartments
apt.
Price per m²
Apartments
apt.
transactions
2025
5 571 €
9
5 323 €
13
2024
5 435 €
25
4 972 €
27
2023
5 762 €
29
4 985 €
35
2022
6 181 €
26
5 157 €
59
2021
5 586 €
24
5 216 €
45
2020
5 766 €
32
5 093 €
41
2019
5 108 €
28
4 385 €
43
2018
5 232 €
34
4 452 €
42
2017
4 860 €
30
4 304 €
41
2016
4 597 €
31
3 978 €
38
2015
4 579 €
37
3 940 €
22
2014
5 001 €
30
4 244 €
30

Quarterly evolution

Median price per m²

Number of transactions

Analysis

Structure of prices per m²

Values of price percentiles per m² over the periods used for the estimated price of each type of property.

Yvelines (78)

Most expensive cities

City
name
Descending orderHouses
house
Price per m²
8 326 €
7 960 €
7 952 €
7 768 €
7 675 €
7 175 €
7 168 €
6 913 €
6 748 €
6 318 €
City
name
Descending orderApartments
apt.
Price per m²
6 358 €
6 192 €
5 628 €
5 512 €
5 254 €
5 250 €
5 153 €
5 098 €
5 056 €
5 027 €

Least expensive cities

City
name
Ascending orderHouses
house
Price per m²
1 871 €
1 903 €
1 953 €
1 997 €
2 056 €
2 143 €
2 192 €
2 238 €
2 250 €
2 254 €
City
name
Ascending orderApartments
apt.
Price per m²
697 €
729 €
1 274 €
1 500 €
1 526 €
1 578 €
1 594 €
1 675 €
1 710 €
1 714 €