emooki
HomePrice mapTransactions
🇬🇧 English🇫🇷 Français🇩🇪 Deutsch🇪🇸 Español🇮🇹 Italiano

Real estate price map


Real estate price map in the municipality of Sartrouville, choose a section to see transactions by parcel.

Yvelines (78)

Sartrouville - Real estate price m²

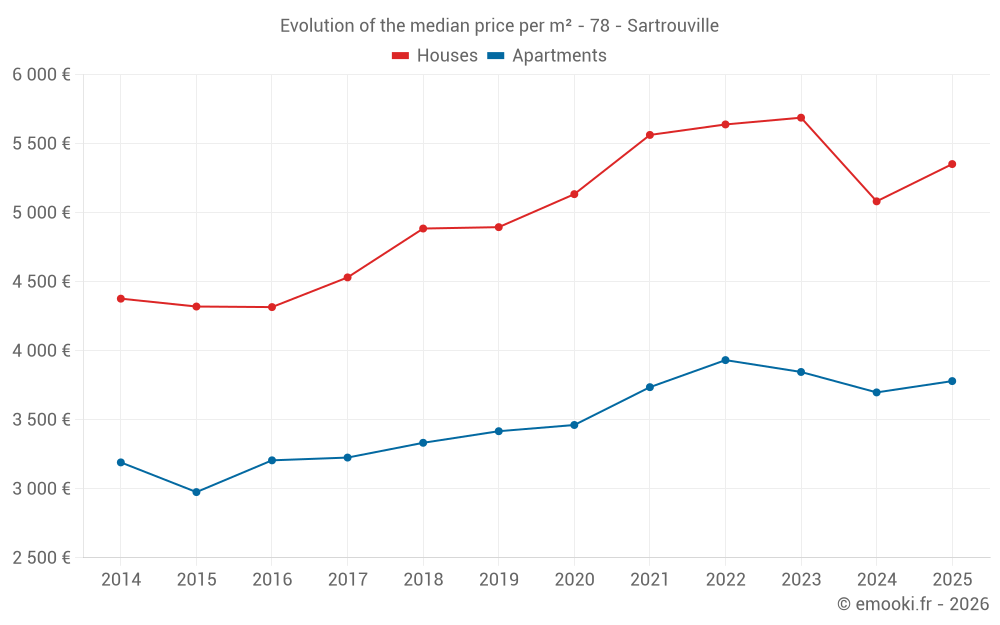
Median price of real estate
in the municipality of Sartrouville

HousesHouses
5 385  /m²
1-23-45-67-89-10
Reliability 10/10
Median price on the 45 transactions of the last 3 months.
from 4 125 to
6 445  /m²
60% of transactions from the 2nd to the 8th deciles.
ApartmentsApartments
3 823  /m²
1-23-45-67-89-10
Reliability 10/10
Median price on the 48 transactions of the last 3 months.
from 2 965 to
4 781  /m²
60% of transactions from the 2nd to the 8th deciles.
DwellingsDwellings
4 435  /m²
1-23-45-67-89-10
Reliability 10/10
Median price on the 93 transactions of the last 3 months.
from 3 385 to
5 791  /m²
60% of transactions from the 2nd to the 8th deciles.
HousesEvolution of the price per m² of houses since...
1 year
+5.3%
2 years
-5.9%
3 years
-5.1%
4 years
-3.8%
5 years
+4.2%
6 years
+9.3%
7 years
+10%
8 years
+18%
9 years
+24%
10 years
+24%
11 years
+22%
The price per m² of houses has decreased by 5.9% since 2 years, but it has increased by 24% in 9 years.
ApartmentsEvolution of the price per m² of apartments since...
1 year
+2.2%
2 years
-1.7%
3 years
-3.9%
4 years
+1.2%
5 years
+9.2%
6 years
+11%
7 years
+13%
8 years
+17%
9 years
+18%
10 years
+27%
11 years
+18%
The price per m² of apartments has decreased by 3.9% since 3 years, but it has increased by 27% in 10 years.

Yearly evolution

Evolution of the median price per m²

Evolution of the median price per m² - 78 - Sartrouville

Evolution of the number of transactions

Warning, last year incomplete. Projections made based on the proportions between semesters of the previous year at the departmental/national level and by type of property.

Evolution of the number of transactions - 78 - Sartrouville

Yearly data

Descending order
Year
Houses
house
transactions
Houses
house
Price per m²
Apartments
apt.
transactions
Apartments
apt.
Price per m²
2025
82
5 352 
103
3 780 
2024
211
5 082 
273
3 698 
2023
202
5 688 
315
3 846 
2022
293
5 639 
466
3 932 
2021
313
5 563 
439
3 736 
2020
267
5 134 
380
3 462 
2019
279
4 895 
437
3 417 
2018
260
4 885 
392
3 333 
2017
306
4 531 
397
3 226 
2016
252
4 316 
336
3 206 
2015
243
4 320 
314
2 976 
2014
247
4 377 
297
3 191 

Analysis

Structure of prices per m²

Values of price percentiles per m² over the periods used for the estimated price of each type of property.

Structure of transaction amounts

Values of transaction amounts percentiles over the periods used for the estimated price of each type of property.

Transaction amounts and prices per m² by percentile

Ascending order
Percentile
Houses
house
Price per m²
Houses
house
Transaction amount
Apartments
apt.
Price per m²
Apartments
apt.
Transaction amount
10th percentile
3 632 
305 K
2 523 
117 K
20th percentile
4 125 
362 K
2 965 
162 K
30th percentile
4 657 
399 K
3 380 
190 K
40th percentile
5 169 
448 K
3 637 
202 K
50th percentile
5 385 
473 K
3 823 
207 K
60th percentile
5 661 
528 K
4 198 
220 K
70th percentile
6 225 
560 K
4 433 
225 K
80th percentile
6 445 
593 K
4 781 
266 K
90th percentile
7 508 
691 K
5 506 
292 K

National and departmental comparison

Evolution of the median price per m² of houses

Evolution of the median price per m² of apartments

Quarterly evolution

Evolution of the median price per m²

Evolution of the number of transactions

Quarterly data

Descending order
Quarter
Houses
house
transactions
Houses
house
Price per m²
Apartments
apt.
transactions
Apartments
apt.
Price per m²
2025 Q2
45
5 385 
48
3 823 
2025 Q1
37
5 305 
55
3 694 
2024 Q4
67
4 977 
69
3 718 
2024 Q3
49
5 119 
77
3 600 
2024 Q2
53
5 026 
70
3 592 
2024 Q1
42
5 152 
57
3 821 
2023 Q4
37
5 800 
58
3 544 
2023 Q3
61
5 357 
82
3 626 
2023 Q2
49
6 105 
91
3 846 
2023 Q1
55
5 708 
84
4 280 
2022 Q4
58
5 876 
89
3 759 
2022 Q3
112
5 606 
141
4 093 
2022 Q2
75
5 400 
109
3 875 
2022 Q1
48
5 703 
127
3 917 
2021 Q4
74
5 811 
97
3 720 
2021 Q3
101
5 343 
122
3 714 
2021 Q2
75
5 545 
123
3 901 
2021 Q1
63
5 549 
97
3 529 
2020 Q4
67
4 938 
107
3 636 
2020 Q3
71
5 275 
80
3 246 
2020 Q2
73
5 170 
103
3 435 
2020 Q1
56
4 867 
90
3 537 
2019 Q4
49
4 803 
118
3 492 
2019 Q3
107
4 953 
128
3 476 
2019 Q2
64
4 627 
111
3 276 
2019 Q1
59
4 941 
80
3 318 
2018 Q4
52
5 000 
87
3 333 
2018 Q3
79
5 121 
101
3 538 
2018 Q2
67
4 839 
112
3 422 
2018 Q1
62
4 514 
92
3 200 
2017 Q4
64
4 557 
97
3 222 
2017 Q3
92
4 662 
95
3 226 
2017 Q2
75
4 474 
106
3 208 
2017 Q1
75
4 322 
99
3 250 
2016 Q4
54
4 258 
81
3 378 
2016 Q3
79
4 267 
86
3 237 
2016 Q2
56
4 399 
85
3 013 
2016 Q1
63
4 314 
84
3 267 
2015 Q4
65
4 368 
68
3 064 
2015 Q3
70
4 384 
89
2 959 
2015 Q2
55
3 923 
94
2 724 
2015 Q1
53
4 392 
63
3 402 
2014 Q4
70
4 230 
77
3 147 
2014 Q3
78
4 522 
68
3 400 
2014 Q2
55
4 510 
79
3 206 
2014 Q1
44
4 318 
73
2 976 

Overview of the latest real estate transactions

The following list is an anonymized overview of the latest transactions. For more details and to find all transactions, please use the map to view transactions by plot or the transaction search page for a search by criteria.

2025-06-30
478 000 
3 886  /m²(123 m²)
Sale
Houses
House
5 rooms
123 m2
Land
405 m2
-Sols
2025-06-30
140 000 
Sale
1 outbuilding
Land
563 m2
-Sols
2025-06-27
399 000 
5 392  /m²(74 m²)
Sale
Apartments
Apartment
4 rooms
74 m2
1 outbuilding
2025-06-27
184 500 
3 548  /m²(52 m²)
Sale
Apartments
Apartment
3 rooms
52 m2
1 outbuilding
2025-06-26
236 000 
4 291  /m²(55 m²)
Sale
Apartments
Apartment
3 rooms
55 m2
1 outbuilding
1 outbuilding
2025-06-26
405 000 
2 935  /m²(138 m²)
Sale
Houses
House
4 rooms
138 m2
Land
406 m2
-Sols
2025-06-24
205 000 
3 417  /m²(60 m²)
Sale
Commercial property
60 m2
2025-06-24
330 000 
6 875  /m²(48 m²)
Sale
Houses
House
3 rooms
48 m2
2025-06-24
195 000 
5 000  /m²(39 m²)
Sale
Apartments
Apartment
2 rooms
39 m2
2 outbuildings
2025-06-24
445 000 
6 268  /m²(71 m²)
Sale
Houses
House
4 rooms
71 m2
Land
113 m2
-Sols
2025-06-20
711 696 
6 470  /m²(110 m²)
Sale
Houses
House
5 rooms
110 m2
Land
350 m2
-Sols
2025-06-19
202 500 
3 164  /m²(64 m²)
Sale
Apartments
Apartment
3 rooms
64 m2
2 outbuildings
2025-06-19
80 000 
4 000  /m²(20 m²)
Sale
Apartments
Apartment
1 room
20 m2
1 outbuilding
2025-06-19
10 000 
Sale
1 outbuilding
2025-06-18
203 600 
4 524  /m²(45 m²)
Sale
Apartments
Apartment
2 rooms
45 m2
2025-06-17
240 000 
5 581  /m²(43 m²)
Sale
Apartments
Apartment
2 rooms
43 m2
1 outbuilding
2025-06-17
297 000 
4 125  /m²(72 m²)
Sale
Houses
House
3 rooms
72 m2
Land
244 m2
-Sols
2025-06-13
425 000 
6 439  /m²(66 m²)
Sale
1 outbuilding
Land
82 m2
-Sols
Houses
House
4 rooms
66 m2
Land
188 m2
-Sols
2025-06-13
212 500 
4 337  /m²(49 m²)
Sale
Houses
House
3 rooms
49 m2
Land
149 m2
-Sols
2025-06-13
572 000 
6 976  /m²(82 m²)
Sale
Houses
House
3 rooms
82 m2
Land
685 m2
-Sols
11032 transactions listed in the municipality

Yvelines (78)

Most expensive cities

City
name
Descending orderHouses
house
Price per m²
7 960 
7 952 
7 768 
7 675 
6 913 
6 748 
6 318 
City
name
Descending orderApartments
apt.
Price per m²
6 192 
5 628 
5 254 
5 250 
5 153 
5 098 
5 056 

Least expensive cities

City
name
Ascending orderHouses
house
Price per m²
1 871 
1 903 
1 953 
1 997 
2 143 
2 192 
2 238 
2 250 
2 254 
City
name
Ascending orderApartments
apt.
Price per m²
729 
1 274 
1 500 
1 526 
1 578 
1 594 
1 675 
1 710