emooki
HomePrice mapTransactions
🇬🇧 English🇫🇷 Français🇩🇪 Deutsch🇪🇸 Español🇮🇹 Italiano

Real estate price map


Real estate price map in the municipality of Houilles.

Yvelines (78)
Houilles

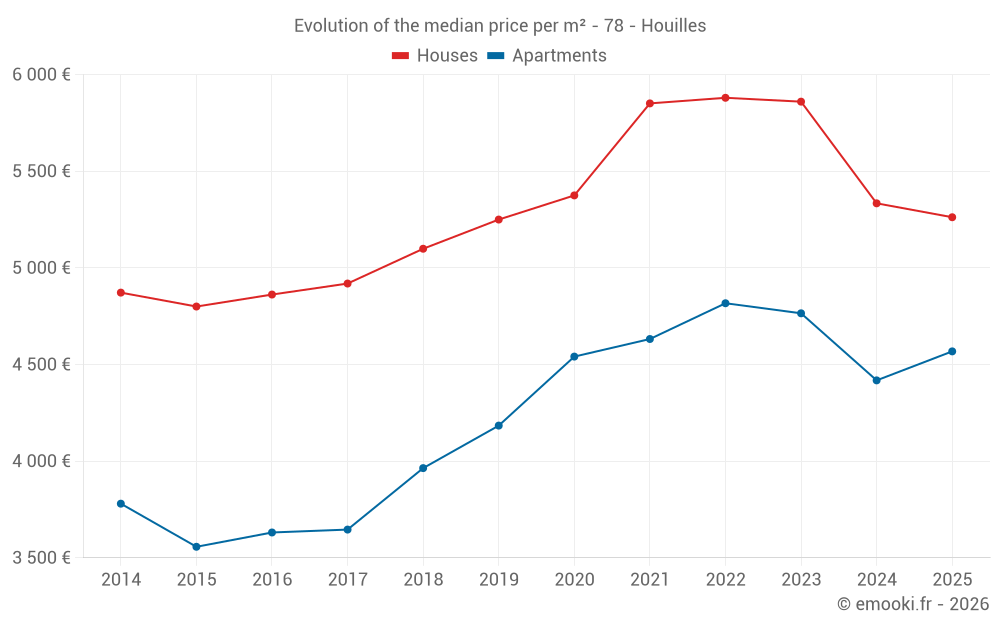
Median price of real estate
in the municipality of Houilles

HousesHouses
5 190 € /m²
1-23-45-67-89-10
Reliability 10/10
Median price on the 36 transactions of the last 3 months.
from 4 024 to
6 308 € /m²
60% of transactions from the 2nd to the 8th deciles.
ApartmentsApartments
3 953 € /m²
1-23-45-67-89-10
Reliability 10/10
Median price on the 35 transactions of the last 3 months.
from 3 364 to
4 904 € /m²
60% of transactions from the 2nd to the 8th deciles.
DwellingsDwellings
4 692 € /m²
1-23-45-67-89-10
Reliability 10/10
Median price on the 71 transactions of the last 3 months.
from 3 544 to
5 641 € /m²
60% of transactions from the 2nd to the 8th deciles.
HousesEvolution of the price per m² of houses since...
1 year
-1.3%
2 years
-10%
3 years
-11%
4 years
-10%
5 years
-2.1%
6 years
+0.2%
7 years
+3.2%
8 years
+7%
9 years
+8.2%
10 years
+10%
11 years
+8%
ApartmentsEvolution of the price per m² of apartments since...
1 year
+3.4%
2 years
-4.1%
3 years
-5.2%
4 years
-1.4%
5 years
+0.6%
6 years
+9.2%
7 years
+15%
8 years
+25%
9 years
+26%
10 years
+28%
11 years
+21%

Yearly evolution

Evolution of the median price per m²

Evolution of the number of transactions

Warning, last year incomplete. Projections made based on the proportions between semesters of the previous year at the departmental/national level and by type of property.

Yearly data

Descending order
Year
Houses
house
transactions
Houses
house
Price per m²
Apartments
apt.
transactions
Apartments
apt.
Price per m²
2025
82
5 262 €
83
4 568 €
2024
146
5 334 €
214
4 418 €
2023
176
5 860 €
239
4 765 €
2022
244
5 880 €
267
4 817 €
2021
279
5 851 €
271
4 632 €
2020
231
5 375 €
249
4 541 €
2019
281
5 250 €
281
4 184 €
2018
256
5 099 €
284
3 964 €
2017
253
4 919 €
299
3 646 €
2016
245
4 862 €
253
3 631 €
2015
223
4 800 €
262
3 557 €
2014
196
4 872 €
224
3 780 €

Analysis

Structure of prices per m²

Values of price percentiles per m² over the periods used for the estimated price of each type of property.

Structure of transaction amounts

Values of transaction amounts percentiles over the periods used for the estimated price of each type of property.

Transaction amounts and prices per m² by percentile

Ascending order
Percentile
Houses
house
Price per m²
Houses
house
Transaction amount
Apartments
apt.
Price per m²
Apartments
apt.
Transaction amount
10th percentile
3 663 €
294 K€
3 046 €
163 K€
20th percentile
4 024 €
318 K€
3 364 €
177 K€
30th percentile
4 710 €
404 K€
3 486 €
186 K€
40th percentile
4 909 €
450 K€
3 792 €
208 K€
50th percentile
5 190 €
463 K€
3 953 €
235 K€
60th percentile
5 491 €
502 K€
4 218 €
247 K€
70th percentile
6 006 €
539 K€
4 467 €
260 K€
80th percentile
6 308 €
660 K€
4 904 €
289 K€
90th percentile
6 973 €
756 K€
5 174 €
369 K€

National and departmental comparison

Evolution of the median price per m² of houses

Evolution of the median price per m² of apartments

Quarterly evolution

Evolution of the median price per m²

Evolution of the number of transactions

Quarterly data

Descending order
Quarter
Houses
house
transactions
Houses
house
Price per m²
Apartments
apt.
transactions
Apartments
apt.
Price per m²
2025 Q2
36
5 190 €
35
3 953 €
2025 Q1
46
5 300 €
48
4 956 €
2024 Q4
39
5 172 €
55
4 103 €
2024 Q3
39
5 870 €
52
4 255 €
2024 Q2
39
5 235 €
52
4 154 €
2024 Q1
29
5 446 €
55
4 750 €
2023 Q4
29
5 250 €
57
4 900 €
2023 Q3
60
5 563 €
60
4 458 €
2023 Q2
40
6 105 €
71
4 817 €
2023 Q1
47
6 117 €
51
4 677 €
2022 Q4
39
5 930 €
57
4 884 €
2022 Q3
88
5 916 €
79
4 833 €
2022 Q2
63
5 849 €
78
4 662 €
2022 Q1
54
5 740 €
53
4 889 €
2021 Q4
52
5 824 €
70
4 740 €
2021 Q3
102
5 900 €
75
4 711 €
2021 Q2
64
5 472 €
67
4 400 €
2021 Q1
61
6 000 €
59
4 774 €
2020 Q4
67
5 455 €
74
4 699 €
2020 Q3
66
5 540 €
65
4 278 €
2020 Q2
51
5 139 €
49
4 545 €
2020 Q1
47
5 263 €
61
4 478 €
2019 Q4
68
5 066 €
70
4 646 €
2019 Q3
95
5 213 €
94
4 333 €
2019 Q2
62
5 262 €
63
3 914 €
2019 Q1
56
5 308 €
54
3 895 €
2018 Q4
60
4 991 €
55
4 174 €
2018 Q3
88
5 116 €
88
3 929 €
2018 Q2
58
4 794 €
79
3 750 €
2018 Q1
50
5 194 €
62
3 983 €
2017 Q4
61
4 889 €
70
3 518 €
2017 Q3
98
5 278 €
82
3 768 €
2017 Q2
53
4 880 €
63
3 660 €
2017 Q1
41
4 472 €
84
3 604 €
2016 Q4
43
4 967 €
64
3 723 €
2016 Q3
87
4 900 €
61
3 573 €
2016 Q2
53
4 527 €
75
3 493 €
2016 Q1
62
4 900 €
53
3 725 €
2015 Q4
45
4 615 €
67
3 397 €
2015 Q3
73
4 800 €
63
3 471 €
2015 Q2
66
4 801 €
77
3 585 €
2015 Q1
39
5 049 €
55
3 636 €
2014 Q4
49
4 645 €
46
3 843 €
2014 Q3
55
5 192 €
68
3 676 €
2014 Q2
47
4 517 €
51
3 634 €
2014 Q1
45
4 917 €
59
4 000 €

Yvelines (78)

Most expensive cities

City
name
Descending orderHouses
house
Price per m²
8 326 €
7 960 €
7 952 €
7 768 €
7 675 €
7 175 €
7 168 €
6 913 €
6 748 €
6 318 €
City
name
Descending orderApartments
apt.
Price per m²
6 358 €
6 192 €
5 628 €
5 512 €
5 254 €
5 250 €
5 153 €
5 098 €
5 056 €
5 027 €

Least expensive cities

City
name
Ascending orderHouses
house
Price per m²
1 871 €
1 903 €
1 953 €
1 997 €
2 056 €
2 143 €
2 192 €
2 238 €
2 250 €
2 254 €
City
name
Ascending orderApartments
apt.
Price per m²
697 €
729 €
1 274 €
1 500 €
1 526 €
1 578 €
1 594 €
1 675 €
1 710 €
1 714 €