emooki
HomePrice mapTransactions
🇬🇧 English🇫🇷 Français🇩🇪 Deutsch🇪🇸 Español🇮🇹 Italiano

Real estate price map


Real estate price map in the municipality of Jouy-en-Josas, choose a section to see transactions by parcel.

Yvelines (78)

Jouy-en-Josas - Real estate price m²

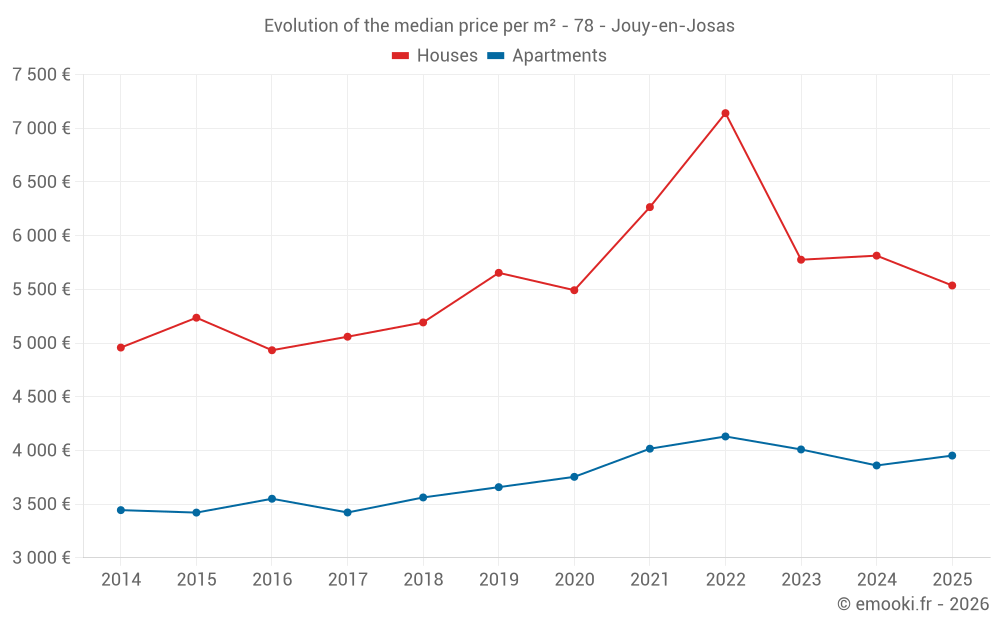
Median price of real estate
in the municipality of Jouy-en-Josas

HousesHouses
5 830  /m²
1-23-45-67-89-10
Reliability 8/10
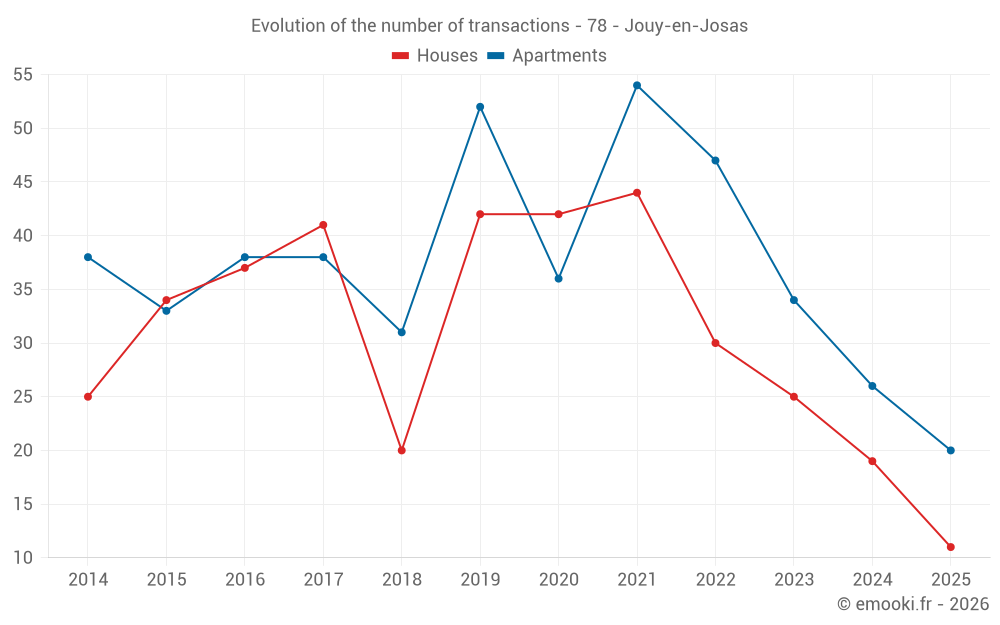
Median price on the 26 transactions of the last 12 months.
from 4 569 to
7 274  /m²
60% of transactions from the 2nd to the 8th deciles.
ApartmentsApartments
3 952  /m²
1-23-45-67-89-10
Reliability 9/10
Median price on the 20 transactions of the last 6 months.
from 3 444 to
4 488  /m²
60% of transactions from the 2nd to the 8th deciles.
DwellingsDwellings
4 267  /m²
1-23-45-67-89-10
Reliability 9/10
Median price on the 31 transactions of the last 6 months.
from 3 740 to
5 333  /m²
60% of transactions from the 2nd to the 8th deciles.
HousesEvolution of the price per m² of houses since...
1 year
-4.8%
2 years
-4.2%
3 years
-22%
4 years
-12%
5 years
+0.8%
6 years
-2.1%
7 years
+6.6%
8 years
+9.4%
9 years
+12%
10 years
+5.7%
11 years
+12%
The price per m² of houses has decreased by 22% since 3 years, but it has increased by 12% in 9 years.
ApartmentsEvolution of the price per m² of apartments since...
1 year
+2.4%
2 years
-1.4%
3 years
-4.3%
4 years
-1.6%
5 years
+5.3%
6 years
+8%
7 years
+11%
8 years
+15%
9 years
+11%
10 years
+16%
11 years
+15%
The price per m² of apartments has decreased by 4.3% since 3 years, but it has increased by 16% in 10 years.

Yearly evolution

Evolution of the median price per m²

Evolution of the median price per m² - 78 - Jouy-en-Josas

Evolution of the number of transactions

Warning, last year incomplete. Projections made based on the proportions between semesters of the previous year at the departmental/national level and by type of property.

Evolution of the number of transactions - 78 - Jouy-en-Josas

Yearly data

Descending order
Year
Houses
house
transactions
Houses
house
Price per m²
Apartments
apt.
transactions
Apartments
apt.
Price per m²
2025
11
5 536 
20
3 952 
2024
19
5 814 
26
3 860 
2023
25
5 776 
34
4 009 
2022
30
7 141 
47
4 130 
2021
44
6 266 
54
4 016 
2020
42
5 492 
36
3 754 
2019
42
5 654 
52
3 658 
2018
20
5 192 
31
3 562 
2017
41
5 059 
38
3 422 
2016
37
4 933 
38
3 550 
2015
34
5 236 
33
3 421 
2014
25
4 958 
38
3 444 

Analysis

Structure of prices per m²

Values of price percentiles per m² over the periods used for the estimated price of each type of property.

Structure of transaction amounts

Values of transaction amounts percentiles over the periods used for the estimated price of each type of property.

Transaction amounts and prices per m² by percentile

Ascending order
Percentile
Houses
house
Price per m²
Houses
house
Transaction amount
Apartments
apt.
Price per m²
Apartments
apt.
Transaction amount
10th percentile
4 316 
338 K
3 219 
151 K
20th percentile
4 569 
427 K
3 444 
158 K
30th percentile
5 218 
471 K
3 760 
171 K
40th percentile
5 776 
558 K
3 868 
182 K
50th percentile
5 830 
585 K
3 952 
258 K
60th percentile
5 958 
605 K
4 015 
308 K
70th percentile
6 286 
620 K
4 322 
348 K
80th percentile
7 274 
715 K
4 488 
379 K
90th percentile
7 398 
1 008 K
5 019 
450 K

National and departmental comparison

Evolution of the median price per m² of houses

Evolution of the median price per m² of apartments

Quarterly evolution

Evolution of the median price per m²

Evolution of the number of transactions

Quarterly data

Descending order
Quarter
Houses
house
transactions
Houses
house
Price per m²
Apartments
apt.
transactions
Apartments
apt.
Price per m²
2025 Q2
5
6 957 
5
3 779 
2025 Q1
6
5 218 
15
3 987 
2024 Q4
6
5 820 
3
4 286 
2024 Q3
9
5 862 
11
3 818 
2024 Q2
3
2 472 
5
3 744 
2024 Q1
1
12 037 
7
3 679 
2023 Q4
7
5 776 
12
3 850 
2023 Q3
7
5 256 
10
4 217 
2023 Q2
4
6 572 
6
4 822 
2023 Q1
7
5 638 
6
3 882 
2022 Q4
8
6 536 
13
4 135 
2022 Q3
8
7 861 
14
4 002 
2022 Q2
10
8 706 
11
4 137 
2022 Q1
4
5 342 
9
4 099 
2021 Q4
7
6 599 
10
4 106 
2021 Q3
14
6 550 
17
4 000 
2021 Q2
13
5 742 
14
3 781 
2021 Q1
10
6 630 
13
4 428 
2020 Q4
12
4 982 
15
3 961 
2020 Q3
9
4 963 
6
3 595 
2020 Q2
11
4 780 
5
3 888 
2020 Q1
10
5 992 
10
3 552 
2019 Q4
9
4 420 
11
3 947 
2019 Q3
16
5 868 
13
3 654 
2019 Q2
10
6 426 
15
3 705 
2019 Q1
7
5 149 
13
3 568 
2018 Q4
5
5 500 
4
2 960 
2018 Q3
5
4 978 
13
3 425 
2018 Q2
5
5 097 
7
3 769 
2018 Q1
5
5 519 
7
3 716 
2017 Q4
6
6 332 
9
3 368 
2017 Q3
22
5 069 
15
3 462 
2017 Q2
10
4 856 
12
3 545 
2017 Q1
3
4 825 
2
3 172 
2016 Q4
6
4 996 
7
3 221 
2016 Q3
15
5 167 
14
3 573 
2016 Q2
8
4 934 
9
3 907 
2016 Q1
8
4 639 
8
3 370 
2015 Q4
11
5 250 
8
3 762 
2015 Q3
10
5 372 
14
3 489 
2015 Q2
11
4 897 
6
3 256 
2015 Q1
2
4 297 
5
3 357 
2014 Q4
4
5 678 
14
3 322 
2014 Q3
8
4 831 
6
3 428 
2014 Q2
4
4 744 
12
3 458 
2014 Q1
9
4 746 
6
3 584 

Overview of the latest real estate transactions

The following list is an anonymized overview of the latest transactions. For more details and to find all transactions, please use the map to view transactions by plot or the transaction search page for a search by criteria.

2025-06-17
32 000 
Sale
1 outbuilding
2025-06-04
12 000 
Sale
1 outbuilding
2025-06-03
300 000 
10 000  /m²(30 m²)
Sale
Houses
House
1 room
30 m2
Land
314 m2
-Sols
2025-06-02
620 000 
5 536  /m²(112 m²)
Sale
Houses
House
5 rooms
112 m2
2025-05-30
187 000 
3 740  /m²(50 m²)
Sale
Apartments
Apartment
2 rooms
50 m2
1 outbuilding
2025-05-27
291 000 
3 779  /m²(77 m²)
Sale
Apartments
Apartment
4 rooms
77 m2
1 outbuilding
1 outbuilding
2025-05-26
30 000 
Sale
1 outbuilding
2025-05-13
25 114 
Sale
Land
52 m2
-Sols
Land
13344 m2
-Sols
Land
1136 m2
-Sols
Land
129 m2
-Sols
Land
28 m2
-Taillis sous futaie
Land
26 m2
-Sols
2025-04-30
600 600 
3 229  /m²(186 m²)
Sale
Apartments
Apartment
6 rooms
186 m2
1 outbuilding
2025-04-29
1 337 310 
7 348  /m²(182 m²)
Sale
Land
453 m2
-Terrains à bâtir
Land
101 m2
-Terrains à bâtir
Houses
House
5 rooms
182 m2
1 outbuilding
Land
1172 m2
-Sols
Land
39 m2
-Sols
2025-04-24
1 600 065 
6 957  /m²(230 m²)
Sale
Houses
House
7 rooms
230 m2
1 outbuilding
Land
620 m2
-Sols
Land
4349 m2
-Terrains d'agrément
Land
4511 m2
-Taillis simples
2025-04-18
381 000 
4 482  /m²(85 m²)
Sale
Apartments
Apartment
3 rooms
85 m2
2025-04-11
263 000 
3 757  /m²(70 m²)
Sale
Houses
House
3 rooms
70 m2
Land
725 m2
-Taillis simples
Land
141 m2
-Sols
2025-04-10
30 000 
Sale
1 outbuilding
2025-04-04
172 800 
3 927  /m²(44 m²)
Sale
2 outbuildings
Apartments
Apartment
2 rooms
44 m2
2025-03-31
157 910 
3 948  /m²(40 m²)
Sale
Apartments
Apartment
2 rooms
40 m2
Land
61 m2
-Sols
2025-03-28
347 000 
4 449  /m²(78 m²)
Sale
1 outbuilding
Apartments
Apartment
3 rooms
78 m2
2025-03-27
350 000 
3 125  /m²(112 m²)
Sale
Apartments
Apartment
5 rooms
112 m2
1 outbuilding
2025-03-20
135 000 
5 192  /m²(26 m²)
Sale
Apartments
Apartment
1 room
26 m2
2 outbuildings
2025-03-18
91 000 
3 957  /m²(23 m²)
Sale
Apartments
Apartment
1 room
23 m2
1063 transactions listed in the municipality

Yvelines (78)

Most expensive cities

City
name
Descending orderHouses
house
Price per m²
7 960 
7 952 
7 768 
7 675 
6 913 
6 748 
6 318 
City
name
Descending orderApartments
apt.
Price per m²
6 192 
5 628 
5 254 
5 250 
5 153 
5 098 
5 056 

Least expensive cities

City
name
Ascending orderHouses
house
Price per m²
1 871 
1 903 
1 953 
1 997 
2 143 
2 192 
2 238 
2 250 
2 254 
City
name
Ascending orderApartments
apt.
Price per m²
729 
1 274 
1 500 
1 526 
1 578 
1 594 
1 675 
1 710