Median price of real estate
in the municipality of Mousseaux-lès-Bray
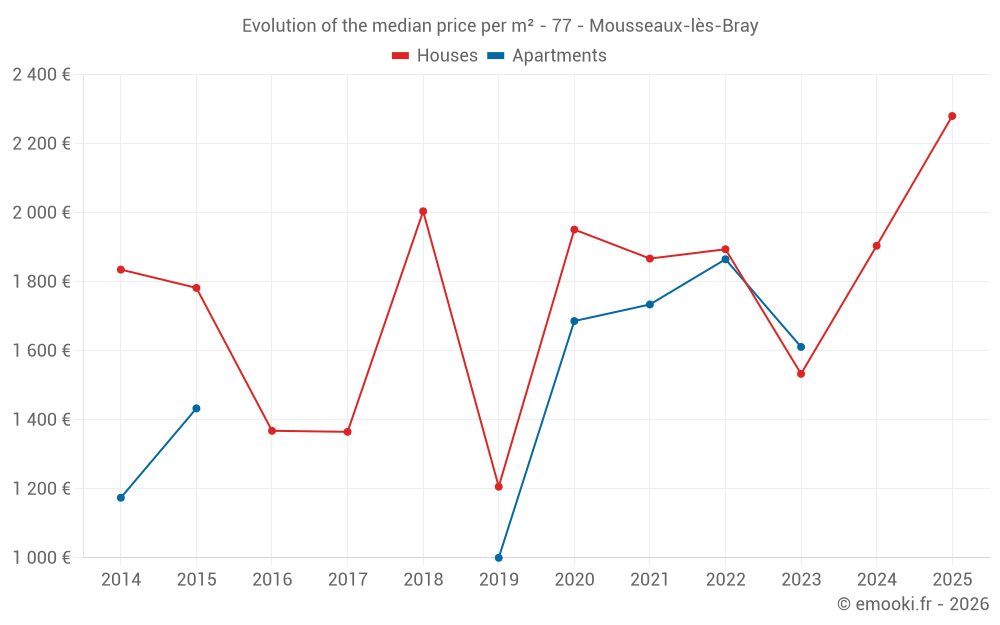
Houses
1 940 € /m²
Reliability 6/10
Median price on the 20 transactions of the last 36 months.
from 1 557 to
2 389 € /m²
2 389 € /m²
60% of transactions from the 2nd to the 8th deciles.
Apartments
1 703 € /m²
Reliability 4/10
Median price on the 8 transactions of the last 60 months.
Dwellings
1 934 € /m²
Reliability 6/10
Median price on the 24 transactions of the last 36 months.
from 1 551 to
2 327 € /m²
2 327 € /m²
60% of transactions from the 2nd to the 8th deciles.