emooki
HomePrice mapTransactions
🇬🇧 English🇫🇷 Français🇩🇪 Deutsch🇪🇸 Español🇮🇹 Italiano

Real estate price map


Real estate price map in the municipality of Lorrez-le-Bocage-Préaux.

Seine-et-Marne (77)
Lorrez-le-Bocage-Préaux

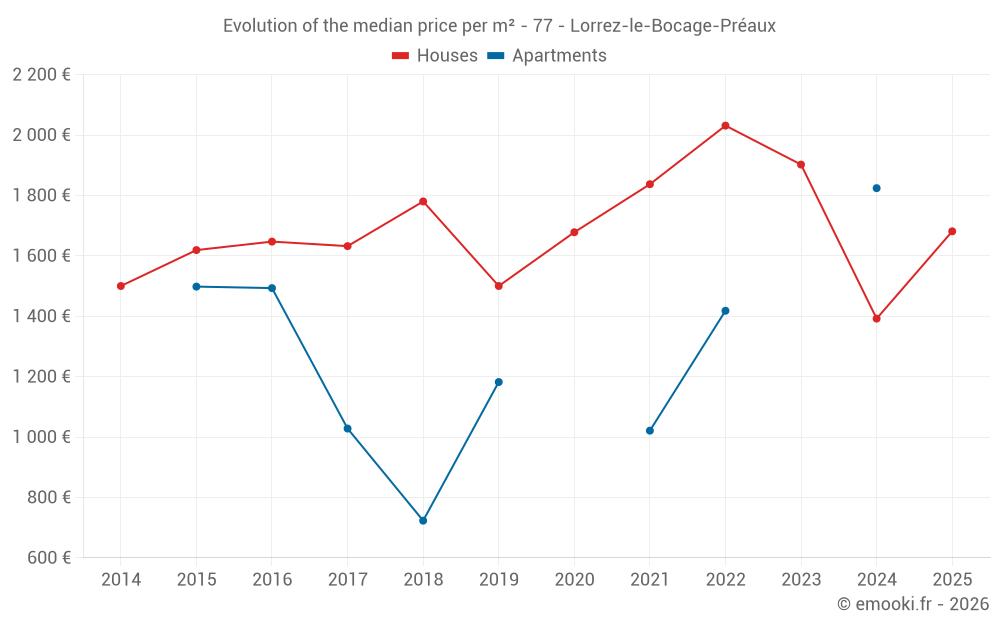
Median price of real estate
in the municipality of Lorrez-le-Bocage-Préaux

HousesHouses
1 700  /m²
1-23-45-67-89-10
Reliability 7/10
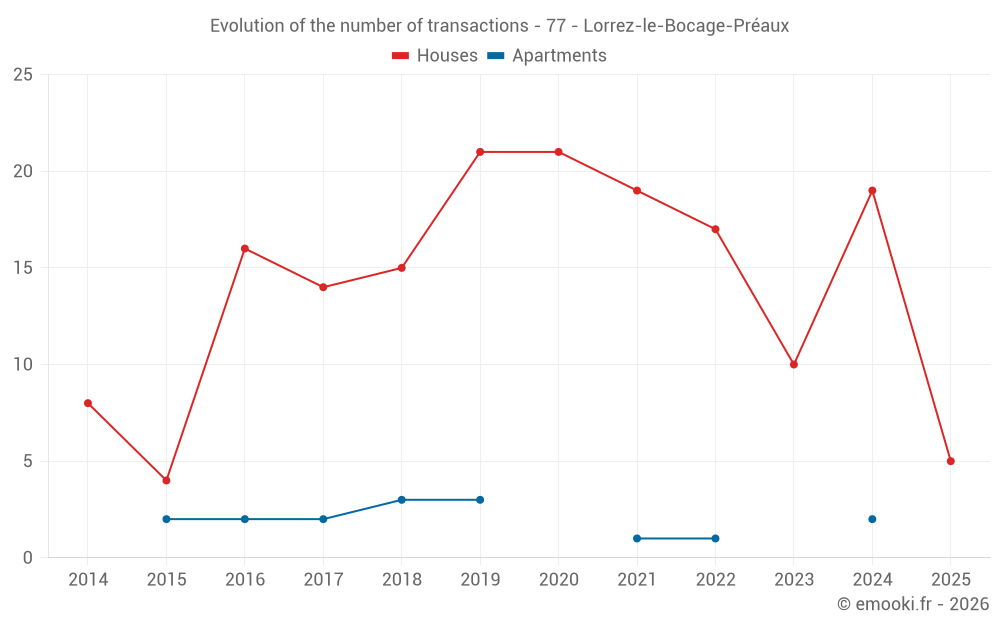
Median price on the 28 transactions of the last 24 months.
from 1 123 to
2 252  /m²
60% of transactions from the 2nd to the 8th deciles.
ApartmentsApartments
1 226  /m²
1-23-45-67-89-10
Reliability 2/10
Median price on the 10 transactions of the last 96 months.
DwellingsDwellings
1 700  /m²
1-23-45-67-89-10
Reliability 7/10
Median price on the 30 transactions of the last 24 months.
from 1 124 to
2 335  /m²
60% of transactions from the 2nd to the 8th deciles.
HousesEvolution of the price per m² of houses since...
1 year
+21%
2 years
-12%
3 years
-17%
4 years
-8.5%
5 years
+0.2%
6 years
+12%
7 years
-5.6%
8 years
+3%
9 years
+2.1%
10 years
--
11 years
+12%
ApartmentsEvolution of the price per m² of apartments since...
1 year
--
2 years
--
3 years
--
4 years
--
5 years
--
6 years
--
7 years
--
8 years
--
9 years
--
10 years
--
11 years
--

Yearly evolution

Evolution of the median price per m²

Evolution of the number of transactions

Warning, last year incomplete. Projections made based on the proportions between semesters of the previous year at the departmental/national level and by type of property.

Yearly data

Descending order
Year
Houses
house
transactions
Houses
house
Price per m²
Apartments
apt.
transactions
Apartments
apt.
Price per m²
2025
5
1 681 
0
--- 
2024
19
1 392 
2
1 824 
2023
10
1 902 
0
--- 
2022
17
2 031 
1
1 418 
2021
19
1 837 
1
1 021 
2020
21
1 678 
0
--- 
2019
21
1 500 
3
1 182 
2018
15
1 780 
3
723 
2017
14
1 632 
2
1 028 
2016
16
1 647 
2
1 493 
2015
4
1 619 
2
1 498 
2014
8
1 500 
0
--- 

Analysis

Structure of prices per m²

Values of price percentiles per m² over the periods used for the estimated price of each type of property.

Structure of transaction amounts

Values of transaction amounts percentiles over the periods used for the estimated price of each type of property.

Transaction amounts and prices per m² by percentile

Ascending order
Percentile
Houses
house
Price per m²
Houses
house
Transaction amount
Apartments
apt.
Price per m²
Apartments
apt.
Transaction amount
10th percentile
760 
76 000 
722 
114 K
20th percentile
1 123 
95 986 
961 
143 K
30th percentile
1 233 
120 K
1 097 
149 K
40th percentile
1 372 
143 K
1 161 
156 K
50th percentile
1 700 
166 K
1 226 
163 K
60th percentile
1 900 
186 K
1 329 
168 K
70th percentile
2 036 
215 K
1 489 
196 K
80th percentile
2 252 
234 K
1 703 
257 K
90th percentile
2 425 
270 K
1 939 
292 K

National and departmental comparison

Evolution of the median price per m² of houses

Evolution of the median price per m² of apartments

Quarterly evolution

Evolution of the median price per m²

Evolution of the number of transactions

Quarterly data

Descending order
Quarter
Houses
house
transactions
Houses
house
Price per m²
Apartments
apt.
transactions
Apartments
apt.
Price per m²
2025 Q2
1
1 918 
0
--- 
2025 Q1
4
1 438 
0
--- 
2024 Q4
3
2 143 
0
--- 
2024 Q3
3
1 867 
2
1 824 
2024 Q2
7
1 121 
0
--- 
2024 Q1
6
1 370 
0
--- 
2023 Q4
3
2 389 
0
--- 
2023 Q3
1
2 073 
0
--- 
2023 Q1
6
1 868 
0
--- 
2022 Q4
1
2 378 
0
--- 
2022 Q3
5
1 942 
0
--- 
2022 Q2
4
2 212 
0
--- 
2022 Q1
7
1 641 
1
1 418 
2021 Q4
3
1 642 
0
--- 
2021 Q3
4
2 079 
0
--- 
2021 Q2
5
2 115 
0
--- 
2021 Q1
7
1 619 
1
1 021 
2020 Q4
13
1 678 
0
--- 
2020 Q3
4
1 512 
0
--- 
2020 Q2
2
2 028 
0
--- 
2020 Q1
2
2 184 
0
--- 
2019 Q4
5
1 500 
1
1 130 
2019 Q3
7
1 405 
0
--- 
2019 Q2
4
1 556 
0
--- 
2019 Q1
5
1 895 
2
1 419 
2018 Q4
4
1 652 
1
711 
2018 Q3
3
1 448 
0
--- 
2018 Q2
5
1 920 
1
723 
2018 Q1
3
1 986 
1
1 890 
2017 Q4
6
1 749 
0
--- 
2017 Q2
5
1 364 
1
625 
2017 Q1
3
1 886 
1
1 432 
2016 Q4
6
1 500 
0
--- 
2016 Q3
3
1 975 
0
--- 
2016 Q2
4
1 647 
2
1 493 
2016 Q1
3
1 449 
0
--- 
2015 Q4
3
1 627 
1
1 644 
2015 Q3
1
1 611 
1
1 353 
2014 Q4
2
1 401 
0
--- 
2014 Q2
1
379 
0
--- 
2014 Q1
5
1 742 
0
--- 

Seine-et-Marne (77)

Most expensive cities

City
name
Descending orderHouses
house
Price per m²
5 573 
4 928 
4 680 
4 436 
4 277 
4 214 
4 098 
City
name
Descending orderApartments
apt.
Price per m²
64 397 
10 818 
4 800 
4 625 
4 584 
4 574 
4 430 

Least expensive cities

City
name
Ascending orderHouses
house
Price per m²
1 052 
1 280 
1 330 
1 338 
1 341 
1 406 
City
name
Ascending orderApartments
apt.
Price per m²
580 
675 
682