Real estate price map
Real estate price map in the municipality of Châtillon-la-Borde, choose a section to see transactions by parcel.
Seine-et-Marne (77)
Price per m² in Châtillon-la-Borde
Median price of real estate
in the municipality of Châtillon-la-Borde
Houses
2 892 € /m²
Reliability 6/10
Median price on the 12 transactions of the last 36 months.
from 1 959 to
3 563 € /m²
3 563 € /m²
60% of transactions from the 2nd to the 8th deciles.
Apartments
1 434 € /m²
Reliability 3/10
Median price on the 6 transactions of the last 72 months.
Dwellings
2 892 € /m²
Reliability 6/10
Median price on the 14 transactions of the last 36 months.
from 1 659 to
3 512 € /m²
3 512 € /m²
60% of transactions from the 2nd to the 8th deciles.
Evolution of the price per m² of houses since...
1 year
--
2 years
--
3 years
+0.4%
4 years
+44%
5 years
--
6 years
+33%
7 years
+13%
8 years
+32%
9 years
+124%
10 years
+53%
11 years
--
82 transactions listed in the municipality
Yearly data
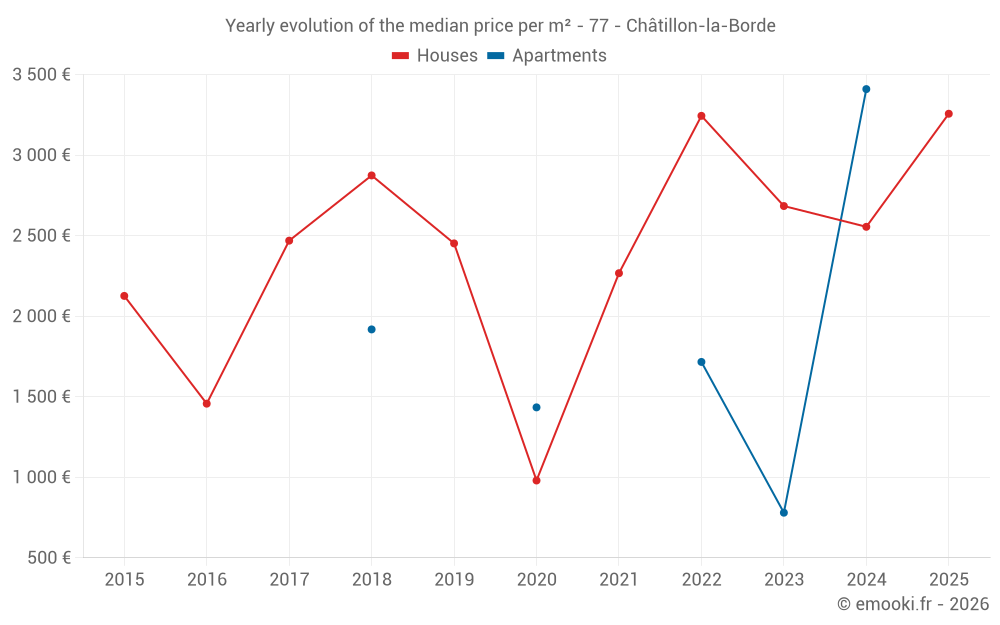
Yearly evolution of the median price per m²
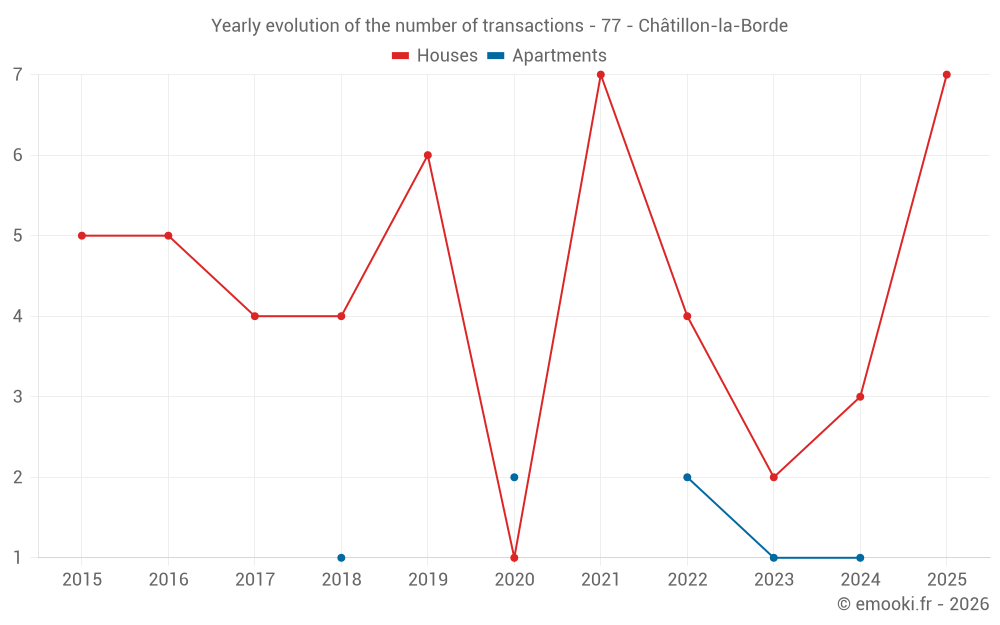
Yearly evolution of the number of transactions
Yearly table
Year
house
transactions
transactions
house
Price per m²
Price per m²
apt.
transactions
transactions
apt.
Price per m²
Price per m²
2025
7
3 257 €
0
--- €
2024
3
2 555 €
1
3 410 €
2023
2
2 684 €
1
780 €
2022
4
3 244 €
2
1 716 €
2021
7
2 267 €
0
--- €
2020
1
980 €
2
1 434 €
2019
6
2 452 €
0
--- €
2018
4
2 874 €
1
1 918 €
2017
4
2 469 €
0
--- €
2016
5
1 457 €
0
--- €
2015
5
2 126 €
0
--- €
2014
0
--- €
0
--- €
Analysis
Structure of prices per m²
Values of price percentiles per m² over the periods used for the estimated price of each type of property.
Structure of transaction amounts
Values of transaction amounts percentiles over the periods used for the estimated price of each type of property.
Transaction amounts and prices per m² by percentile
Percentile
house
Price per m²
Price per m²
house
Transaction amount
Transaction amount
apt.
Price per m²
Price per m²
apt.
Transaction amount
Transaction amount
10th percentile
1 363 €
138 K€
752 €
102 K€
20th percentile
1 959 €
184 K€
780 €
145 K€
30th percentile
2 318 €
208 K€
918 €
158 K€
40th percentile
2 561 €
241 K€
1 055 €
170 K€
50th percentile
2 892 €
278 K€
1 434 €
200 K€
60th percentile
3 240 €
299 K€
1 813 €
230 K€
70th percentile
3 400 €
316 K€
2 260 €
251 K€
80th percentile
3 563 €
324 K€
2 706 €
273 K€
90th percentile
3 588 €
326 K€
3 058 €
418 K€
National and departmental comparison
Evolution of the median price per m² of houses
Evolution of the median price per m² of apartments
Quarterly data
Quarterly evolution of the median price per m²
Quarterly evolution of the number of transactions
Quarterly table
Quarter
house
transactions
transactions
house
Price per m²
Price per m²
apt.
transactions
transactions
apt.
Price per m²
Price per m²
2025 Q4
2
2 914 €
0
--- €
2025 Q3
2
1 426 €
0
--- €
2025 Q2
2
3 588 €
0
--- €
2025 Q1
1
3 462 €
0
--- €
2024 Q4
1
2 555 €
0
--- €
2024 Q3
0
--- €
1
3 410 €
2024 Q1
2
2 716 €
0
--- €
2023 Q4
1
4 063 €
0
--- €
2023 Q3
1
1 304 €
0
--- €
2023 Q2
0
--- €
1
780 €
2022 Q4
3
4 068 €
0
--- €
2022 Q3
1
1 374 €
1
2 706 €
2022 Q1
0
--- €
1
725 €
2021 Q4
1
517 €
0
--- €
2021 Q3
5
2 267 €
0
--- €
2021 Q1
1
3 655 €
0
--- €
2020 Q4
0
--- €
1
1 055 €
2020 Q3
0
--- €
1
1 813 €
2020 Q1
1
980 €
0
--- €
2019 Q4
2
3 420 €
0
--- €
2019 Q3
2
1 922 €
0
--- €
2019 Q2
1
1 663 €
0
--- €
2019 Q1
1
2 591 €
0
--- €
2018 Q4
1
741 €
0
--- €
2018 Q3
1
2 818 €
0
--- €
2018 Q2
1
2 931 €
1
1 918 €
2018 Q1
1
3 041 €
0
--- €
2017 Q4
2
2 088 €
0
--- €
2017 Q3
1
3 198 €
0
--- €
2017 Q1
1
2 105 €
0
--- €
2016 Q2
2
1 357 €
0
--- €
2016 Q1
3
2 088 €
0
--- €
2015 Q4
1
728 €
0
--- €
2015 Q3
1
2 126 €
0
--- €
2015 Q2
3
2 154 €
0
--- €
Compare with neighboring municipalities
City
name
name
house
Price per m²
Price per m²
apt.
Price per m²
Price per m²
City information
Zip code
- 77820 CHATILLON LA BORDE