emooki
HomePrice mapTransactions
🇬🇧 English🇫🇷 Français🇩🇪 Deutsch🇪🇸 Español🇮🇹 Italiano

Real estate price map


Real estate price map in the municipality of Bouleurs, choose a section to see transactions by parcel.

Seine-et-Marne (77)

Bouleurs - Real estate price m²

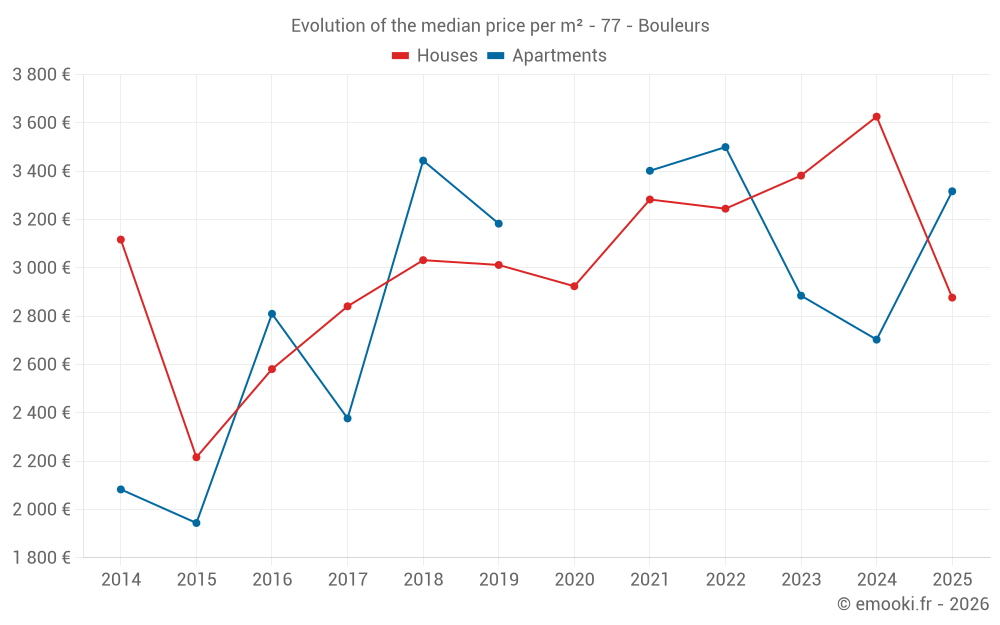
Median price of real estate
in the municipality of Bouleurs

HousesHouses
3 449  /m²
1-23-45-67-89-10
Reliability 7/10
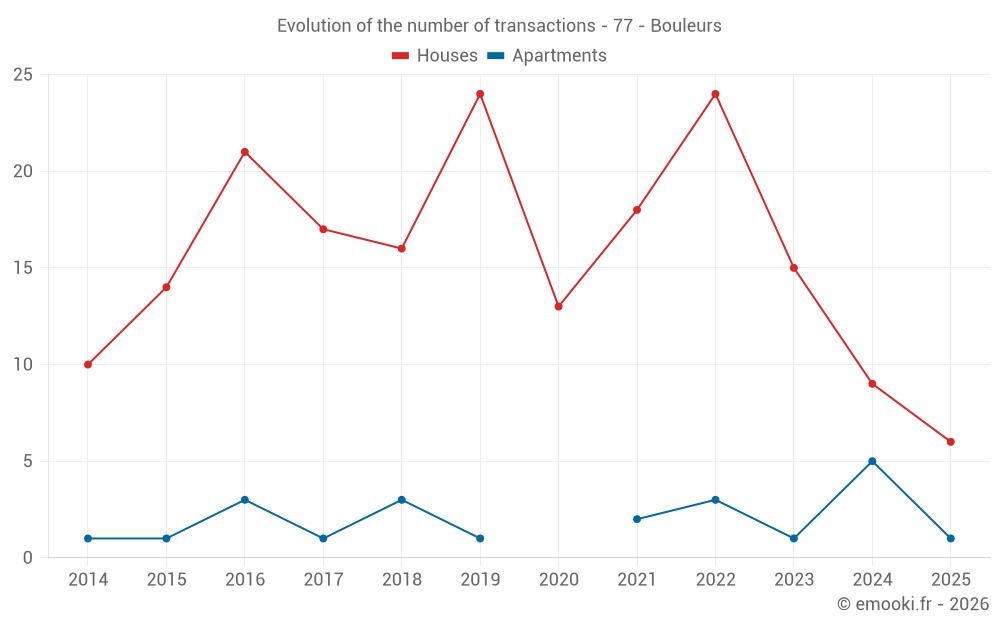
Median price on the 21 transactions of the last 24 months.
from 2 684 to
3 847  /m²
60% of transactions from the 2nd to the 8th deciles.
ApartmentsApartments
3 243  /m²
1-23-45-67-89-10
Reliability 5/10
Median price on the 10 transactions of the last 48 months.
DwellingsDwellings
3 449  /m²
1-23-45-67-89-10
Reliability 8/10
Median price on the 17 transactions of the last 12 months.
from 2 410 to
3 807  /m²
60% of transactions from the 2nd to the 8th deciles.
HousesEvolution of the price per m² of houses since...
1 year
-21%
2 years
-15%
3 years
-11%
4 years
-12%
5 years
-1.6%
6 years
-4.5%
7 years
-5.1%
8 years
+1.3%
9 years
+11%
10 years
+30%
11 years
-7.7%
The price per m² of houses has decreased by 21% since 1 year, but it has increased by 30% in 10 years.

Yearly evolution

Evolution of the median price per m²

Evolution of the median price per m² - 77 - Bouleurs

Evolution of the number of transactions

Warning, last year incomplete. Projections made based on the proportions between semesters of the previous year at the departmental/national level and by type of property.

Evolution of the number of transactions - 77 - Bouleurs

Yearly data

Descending order
Year
Houses
house
transactions
Houses
house
Price per m²
Apartments
apt.
transactions
Apartments
apt.
Price per m²
2025
6
2 877 
1
3 317 
2024
9
3 626 
5
2 703 
2023
15
3 382 
1
2 885 
2022
24
3 245 
3
3 500 
2021
18
3 283 
2
3 402 
2020
13
2 924 
0
--- 
2019
24
3 012 
1
3 183 
2018
16
3 032 
3
3 444 
2017
17
2 841 
1
2 377 
2016
21
2 581 
3
2 810 
2015
14
2 216 
1
1 944 
2014
10
3 117 
1
2 083 

Analysis

Structure of prices per m²

Values of price percentiles per m² over the periods used for the estimated price of each type of property.

Structure of transaction amounts

Values of transaction amounts percentiles over the periods used for the estimated price of each type of property.

Transaction amounts and prices per m² by percentile

Ascending order
Percentile
Houses
house
Price per m²
Houses
house
Transaction amount
Apartments
apt.
Price per m²
Apartments
apt.
Transaction amount
10th percentile
1 768 
255 K
2 388 
137 K
20th percentile
2 684 
288 K
2 641 
148 K
30th percentile
3 173 
304 K
2 830 
164 K
40th percentile
3 382 
330 K
3 055 
180 K
50th percentile
3 449 
343 K
3 243 
193 K
60th percentile
3 626 
350 K
3 390 
203 K
70th percentile
3 646 
373 K
3 527 
212 K
80th percentile
3 847 
404 K
3 615 
218 K
90th percentile
4 040 
452 K
3 719 
225 K

National and departmental comparison

Evolution of the median price per m² of houses

Evolution of the median price per m² of apartments

Quarterly evolution

Evolution of the median price per m²

Evolution of the number of transactions

Quarterly data

Descending order
Quarter
Houses
house
transactions
Houses
house
Price per m²
Apartments
apt.
transactions
Apartments
apt.
Price per m²
2025 Q2
2
3 320 
0
--- 
2025 Q1
4
2 877 
1
3 317 
2024 Q4
3
3 646 
1
2 361 
2024 Q3
3
3 626 
3
2 703 
2024 Q2
1
3 643 
1
3 741 
2024 Q1
2
2 107 
0
--- 
2023 Q4
1
5 195 
0
--- 
2023 Q3
5
3 382 
0
--- 
2023 Q2
4
2 780 
1
2 885 
2023 Q1
5
3 327 
0
--- 
2022 Q4
7
3 760 
0
--- 
2022 Q3
8
3 045 
2
3 443 
2022 Q2
3
4 034 
1
3 500 
2022 Q1
6
3 298 
0
--- 
2021 Q4
5
3 852 
0
--- 
2021 Q3
8
3 283 
0
--- 
2021 Q2
2
2 923 
1
3 267 
2021 Q1
3
3 529 
1
3 536 
2020 Q4
1
3 033 
0
--- 
2020 Q3
6
2 992 
0
--- 
2020 Q2
4
2 566 
0
--- 
2020 Q1
2
2 766 
0
--- 
2019 Q4
7
2 654 
0
--- 
2019 Q3
9
3 045 
1
3 183 
2019 Q2
4
3 126 
0
--- 
2019 Q1
4
2 678 
0
--- 
2018 Q4
4
3 142 
0
--- 
2018 Q3
4
2 798 
2
4 722 
2018 Q2
5
2 369 
1
1 884 
2018 Q1
3
3 091 
0
--- 
2017 Q4
3
2 667 
0
--- 
2017 Q3
10
3 209 
0
--- 
2017 Q2
3
2 841 
1
2 377 
2017 Q1
1
2 311 
0
--- 
2016 Q4
1
3 013 
0
--- 
2016 Q3
12
2 296 
1
3 103 
2016 Q2
4
3 012 
2
2 782 
2016 Q1
4
2 604 
0
--- 
2015 Q4
7
2 108 
0
--- 
2015 Q3
4
2 666 
0
--- 
2015 Q2
1
1 805 
0
--- 
2015 Q1
2
3 544 
1
1 944 
2014 Q4
2
3 118 
0
--- 
2014 Q3
5
3 208 
1
2 083 
2014 Q2
2
3 124 
0
--- 
2014 Q1
1
2 752 
0
--- 

Overview of the latest real estate transactions

The following list is an anonymized overview of the latest transactions. For more details and to find all transactions, please use the map to view transactions by plot or the transaction search page for a search by criteria.

2025-06-30
395 000 
Sale
Land
522 m2
-Sols
2025-06-27
385 000 
4 873  /m²(79 m²)
Sale
Houses
House
4 rooms
79 m2
Land
413 m2
-Sols
2025-06-19
342 900 
1 768  /m²(194 m²)
Sale
Houses
House
9 rooms
194 m2
Land
302 m2
-Terrains d'agrément
/Parc
Land
500 m2
-Sols
Land
664 m2
-Sols
2025-06-11
3 000 
Sale
Land
140 m2
-Prés
Land
495 m2
-Taillis simples
Land
545 m2
-Taillis simples
Land
1920 m2
-Terres
Land
6990 m2
-Taillis simples
2025-03-31
199 000 
3 317  /m²(60 m²)
Sale
Apartments
Apartment
3 rooms
60 m2
2 outbuildings
2025-03-21
50 000 
Sale
Land
1681 m2
-Prés
2025-03-19
117 800 
1 683  /m²(70 m²)
Sale
Houses
House
3 rooms
70 m2
1 outbuilding
Land
500 m2
-Sols
Land
120 m2
-Jardins
/Jardin potager
2025-03-14
126 000 
Sale
Land
470 m2
-Terrains à bâtir
2025-03-11
2 500 
Sale
Land
905 m2
-Terrains d'agrément
/Parc
2025-03-04
51 800 
transaction.nature.Vente terrain à bâtir
Land
86486 m2
-Terres
2025-02-25
245 000 
3 267  /m²(75 m²)
Sale
Houses
House
3 rooms
75 m2
1 outbuilding
Land
122 m2
-Sols
Land
169 m2
-Sols
2025-02-19
146 769 
Sale
Land
146769 m2
-Prés
2025-02-07
373 000 
2 487  /m²(150 m²)
Sale
Houses
House
6 rooms
150 m2
1 outbuilding
Land
790 m2
-Sols
2025-01-24
126 000 
Sale
Land
38 m2
-Terrains à bâtir
Land
131 m2
-Terrains à bâtir
Land
333 m2
-Terrains à bâtir
2025-01-06
404 000 
4 040  /m²(100 m²)
Sale
Houses
House
4 rooms
100 m2
Land
500 m2
-Sols
Land
212 m2
-Terrains d'agrément
/Parc
2024-12-19
6 755 
Sale
Land
4862 m2
-Terres
Land
4863 m2
-Terres
2024-11-21
7 528 
Sale
Land
121 m2
-Terrains à bâtir
Land
820 m2
-Terrains à bâtir
2024-11-21
6 800 
Sale
Land
33 m2
-Terrains à bâtir
Land
113 m2
-Terrains à bâtir
Land
704 m2
-Terrains à bâtir
2024-10-31
5 000 
Sale
1 outbuilding
2024-10-24
338 000 
3 449  /m²(98 m²)
Sale
Houses
House
5 rooms
98 m2
1 outbuilding
Land
500 m2
-Sols
Land
542 m2
-Terrains d'agrément
/Parc
397 transactions listed in the municipality

Seine-et-Marne (77)

Most expensive cities

City
name
Descending orderHouses
house
Price per m²
5 573 
4 928 
4 680 
4 436 
4 277 
4 214 
4 098 
City
name
Descending orderApartments
apt.
Price per m²
64 397 
10 818 
4 800 
4 625 
4 584 
4 574 
4 430 

Least expensive cities

City
name
Ascending orderHouses
house
Price per m²
1 052 
1 280 
1 330 
1 338 
1 341 
1 406 
City
name
Ascending orderApartments
apt.
Price per m²
580 
675 
682