emooki
HomePrice mapTransactions
🇬🇧 English🇫🇷 Français🇩🇪 Deutsch🇪🇸 Español🇮🇹 Italiano

Real estate price map


Real estate price map in the municipality of Villaz, choose a section to see transactions by parcel.

Haute-Savoie (74)

Villaz - Real estate price m²

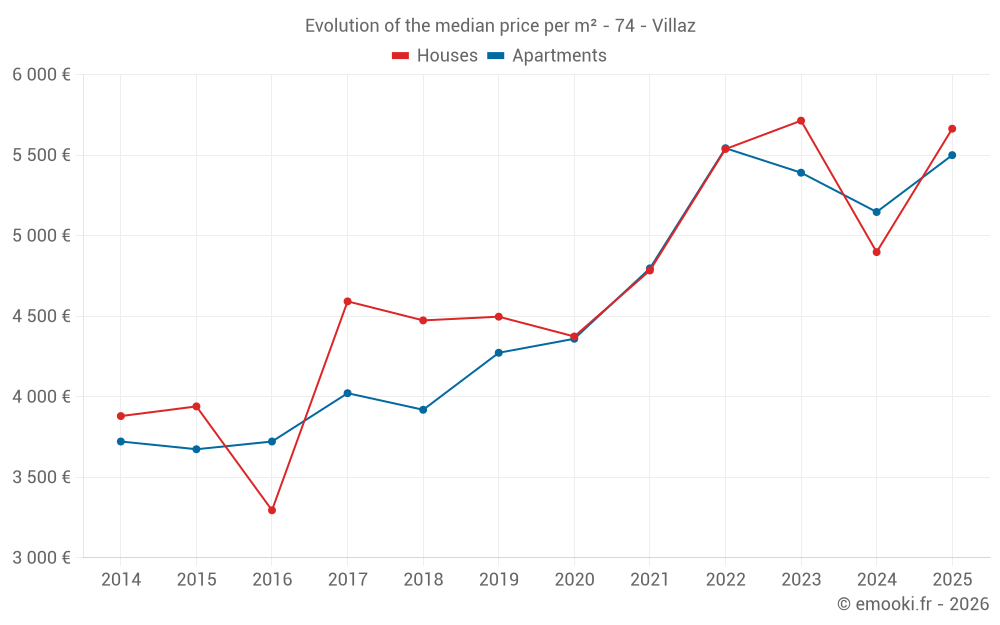
Median price of real estate
in the municipality of Villaz

HousesHouses
5 001  /m²
1-23-45-67-89-10
Reliability 7/10
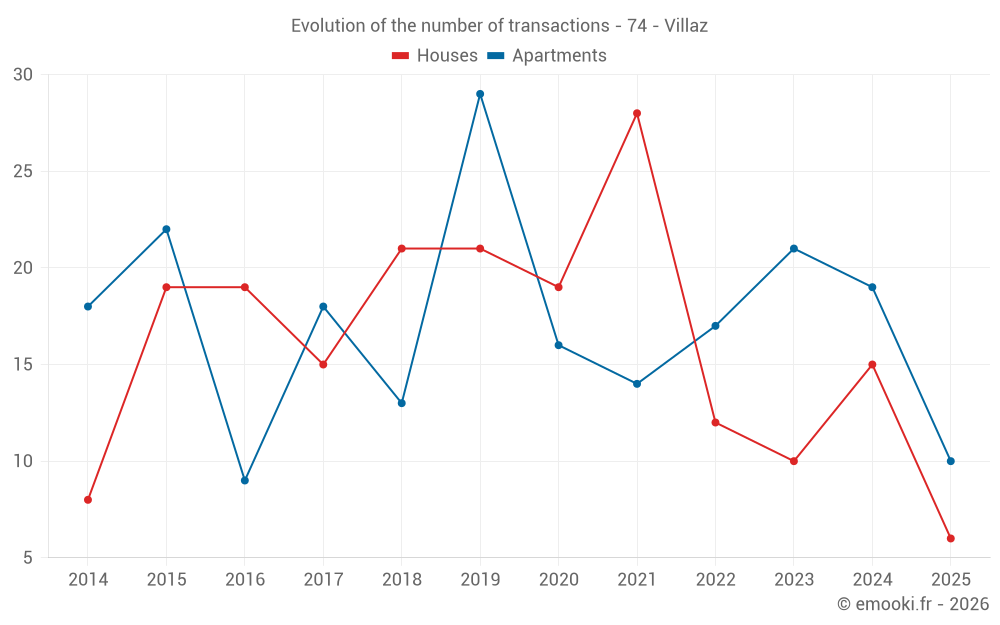
Median price on the 25 transactions of the last 24 months.
from 3 995 to
6 140  /m²
60% of transactions from the 2nd to the 8th deciles.
ApartmentsApartments
5 263  /m²
1-23-45-67-89-10
Reliability 8/10
Median price on the 16 transactions of the last 12 months.
from 4 957 to
5 636  /m²
60% of transactions from the 2nd to the 8th deciles.
DwellingsDwellings
5 147  /m²
1-23-45-67-89-10
Reliability 8/10
Median price on the 29 transactions of the last 12 months.
from 4 332 to
5 893  /m²
60% of transactions from the 2nd to the 8th deciles.
HousesEvolution of the price per m² of houses since...
1 year
+16%
2 years
-0.9%
3 years
+2.3%
4 years
+18%
5 years
+29%
6 years
+26%
7 years
+27%
8 years
+23%
9 years
+72%
10 years
+44%
11 years
+46%
The price per m² of houses has decreased by 0.9% since 2 years, but it has increased by 72% in 9 years.
ApartmentsEvolution of the price per m² of apartments since...
1 year
+6.9%
2 years
+2%
3 years
-0.8%
4 years
+15%
5 years
+26%
6 years
+29%
7 years
+40%
8 years
+37%
9 years
+48%
10 years
+50%
11 years
+48%
The price per m² of apartments has decreased by 0.8% since 3 years, but it has increased by 50% in 10 years.

Yearly evolution

Evolution of the median price per m²

Evolution of the median price per m² - 74 - Villaz

Evolution of the number of transactions

Warning, last year incomplete. Projections made based on the proportions between semesters of the previous year at the departmental/national level and by type of property.

Evolution of the number of transactions - 74 - Villaz

Yearly data

Descending order
Year
Houses
house
transactions
Houses
house
Price per m²
Apartments
apt.
transactions
Apartments
apt.
Price per m²
2025
6
5 664 
10
5 500 
2024
15
4 898 
19
5 147 
2023
10
5 714 
21
5 391 
2022
12
5 538 
17
5 543 
2021
28
4 784 
14
4 797 
2020
19
4 374 
16
4 360 
2019
21
4 497 
29
4 273 
2018
21
4 474 
13
3 919 
2017
15
4 592 
18
4 022 
2016
19
3 295 
9
3 722 
2015
19
3 940 
22
3 674 
2014
8
3 880 
18
3 722 

Analysis

Structure of prices per m²

Values of price percentiles per m² over the periods used for the estimated price of each type of property.

Structure of transaction amounts

Values of transaction amounts percentiles over the periods used for the estimated price of each type of property.

Transaction amounts and prices per m² by percentile

Ascending order
Percentile
Houses
house
Price per m²
Houses
house
Transaction amount
Apartments
apt.
Price per m²
Apartments
apt.
Transaction amount
10th percentile
3 648 
394 K
4 507 
241 K
20th percentile
3 995 
514 K
4 957 
257 K
30th percentile
4 502 
600 K
5 072 
277 K
40th percentile
4 645 
629 K
5 147 
296 K
50th percentile
5 001 
655 K
5 263 
328 K
60th percentile
5 192 
696 K
5 495 
370 K
70th percentile
5 628 
732 K
5 546 
378 K
80th percentile
6 140 
790 K
5 636 
405 K
90th percentile
6 670 
909 K
5 926 
497 K

National and departmental comparison

Evolution of the median price per m² of houses

Evolution of the median price per m² of apartments

Quarterly evolution

Evolution of the median price per m²

Evolution of the number of transactions

Quarterly data

Descending order
Quarter
Houses
house
transactions
Houses
house
Price per m²
Apartments
apt.
transactions
Apartments
apt.
Price per m²
2025 Q2
2
5 088 
5
5 636 
2025 Q1
4
5 746 
5
5 495 
2024 Q4
2
4 122 
4
5 197 
2024 Q3
5
4 898 
2
5 052 
2024 Q2
4
4 363 
7
5 250 
2024 Q1
4
5 517 
6
5 100 
2023 Q4
2
6 050 
7
5 380 
2023 Q3
2
4 794 
2
5 066 
2023 Q2
2
4 993 
6
5 362 
2023 Q1
4
5 825 
6
5 626 
2022 Q4
4
4 688 
6
5 746 
2022 Q3
1
5 869 
6
5 656 
2022 Q2
2
3 478 
4
3 282 
2022 Q1
5
5 921 
1
5 881 
2021 Q4
6
5 259 
2
4 451 
2021 Q3
14
4 568 
6
5 352 
2021 Q2
3
4 141 
3
3 373 
2021 Q1
5
4 779 
3
4 873 
2020 Q4
8
5 068 
4
4 307 
2020 Q3
5
4 579 
3
4 313 
2020 Q2
2
2 926 
3
4 621 
2020 Q1
4
4 328 
6
4 360 
2019 Q4
10
4 200 
11
4 205 
2019 Q3
4
4 625 
5
4 273 
2019 Q2
2
6 052 
4
4 444 
2019 Q1
5
4 497 
9
4 139 
2018 Q4
3
4 780 
5
4 419 
2018 Q3
7
4 315 
1
4 767 
2018 Q2
7
4 665 
3
3 817 
2018 Q1
4
4 256 
4
3 973 
2017 Q4
4
4 252 
9
4 000 
2017 Q3
4
4 771 
2
5 141 
2017 Q2
4
5 170 
4
3 242 
2017 Q1
3
4 429 
3
4 246 
2016 Q4
8
2 996 
0
--- 
2016 Q3
3
3 681 
4
4 134 
2016 Q2
5
3 428 
2
3 537 
2016 Q1
3
4 222 
3
4 218 
2015 Q4
4
3 574 
5
3 790 
2015 Q3
7
4 043 
7
3 900 
2015 Q2
4
3 596 
9
3 162 
2015 Q1
4
3 993 
1
3 740 
2014 Q4
0
--- 
3
3 770 
2014 Q3
0
--- 
5
3 911 
2014 Q2
4
3 882 
5
3 675 
2014 Q1
4
3 880 
5
3 633 

Overview of the latest real estate transactions

The following list is an anonymized overview of the latest transactions. For more details and to find all transactions, please use the map to view transactions by plot or the transaction search page for a search by criteria.

2025-06-24
494 370 
5 259  /m²(94 m²)
Sale
Apartments
Apartment
4 rooms
94 m2
2 outbuildings
2025-06-18
628 000 
3 358  /m²(187 m²)
Sale
Houses
House
5 rooms
187 m2
Land
1355 m2
-Sols
2025-06-11
1 050 000 
6 818  /m²(154 m²)
Sale
Houses
House
7 rooms
154 m2
1 outbuilding
Land
971 m2
-Jardins
Land
955 m2
-Sols
2025-05-14
6 000 
Sale
1 outbuilding
2025-05-14
450 000 
2 542  /m²(177 m²)
Sale
Commercial property
84 m2
Commercial property
93 m2
2025-04-23
6 000 
Sale
1 outbuilding
2025-04-18
295 950 
5 016  /m²(59 m²)
Sale
Apartments
Apartment
3 rooms
59 m2
3 outbuildings
2025-04-17
197 270 
5 636  /m²(35 m²)
Sale
Apartments
Apartment
2 rooms
35 m2
1 outbuilding
2025-04-16
5 000 
Sale
1 outbuilding
2025-04-11
376 650 
6 075  /m²(62 m²)
Sale
Apartments
Apartment
3 rooms
62 m2
3 outbuildings
2025-04-04
950 000 
3 480  /m²(273 m²)
4 922  /m²(193 m²)
Sale
Houses
House
5 rooms
193 m2
Commercial property
80 m2
1 outbuilding
Land
2904 m2
-Sols
2025-04-03
500 000 
6 329  /m²(79 m²)
Sale
Apartments
Apartment
3 rooms
79 m2
1 outbuilding
2025-03-31
6 000 
Sale
1 outbuilding
2025-03-05
253 250 
5 505  /m²(46 m²)
Sale
Apartments
Apartment
2 rooms
46 m2
4 outbuildings
2025-02-20
500 000 
5 495  /m²(91 m²)
Sale
Apartments
Apartment
4 rooms
91 m2
3 outbuildings
2025-02-20
809 900 
6 982  /m²(116 m²)
Sale
Houses
House
4 rooms
116 m2
1 outbuilding
Land
542 m2
-Sols
2025-02-11
325 000 
4 851  /m²(67 m²)
Sale
Apartments
Apartment
3 rooms
67 m2
1 outbuilding
2025-02-10
380 000 
5 588  /m²(68 m²)
Sale
Apartments
Apartment
3 rooms
68 m2
2 outbuildings
2025-02-07
257 300 
3 784  /m²(68 m²)
Sale
Apartments
Apartment
3 rooms
68 m2
1 outbuilding
2025-01-22
685 000 
3 937  /m²(174 m²)
Sale
Houses
House
7 rooms
174 m2
Land
804 m2
-Sols
Land
93 m2
-Sols
850 transactions listed in the municipality

Haute-Savoie (74)

Most expensive cities

City
name
Descending orderHouses
house
Price per m²
15 679 
13 070 
12 664 
12 078 
11 412 
11 019 
10 026 
9 621 
City
name
Descending orderApartments
apt.
Price per m²
9 603 
8 676 
8 394 
7 898 
7 778 
6 792 
6 625 
6 373 

Least expensive cities

City
name
Ascending orderHouses
house
Price per m²
2 070 
2 093 
2 300 
2 436 
2 611 
2 622 
2 709 
2 733 
City
name
Ascending orderApartments
apt.
Price per m²
725 
1 145 
1 250 
1 405 
1 448 
1 548 
1 628 
1 632 
1 674 
1 729