emooki
HomePrice mapTransactions
🇬🇧 English🇫🇷 Français🇩🇪 Deutsch🇪🇸 Español🇮🇹 Italiano

Real estate price map


Real estate price map in the municipality of Le Grand-Bornand, choose a section to see transactions by parcel.

Haute-Savoie (74)

Le Grand-Bornand - Real estate price m²

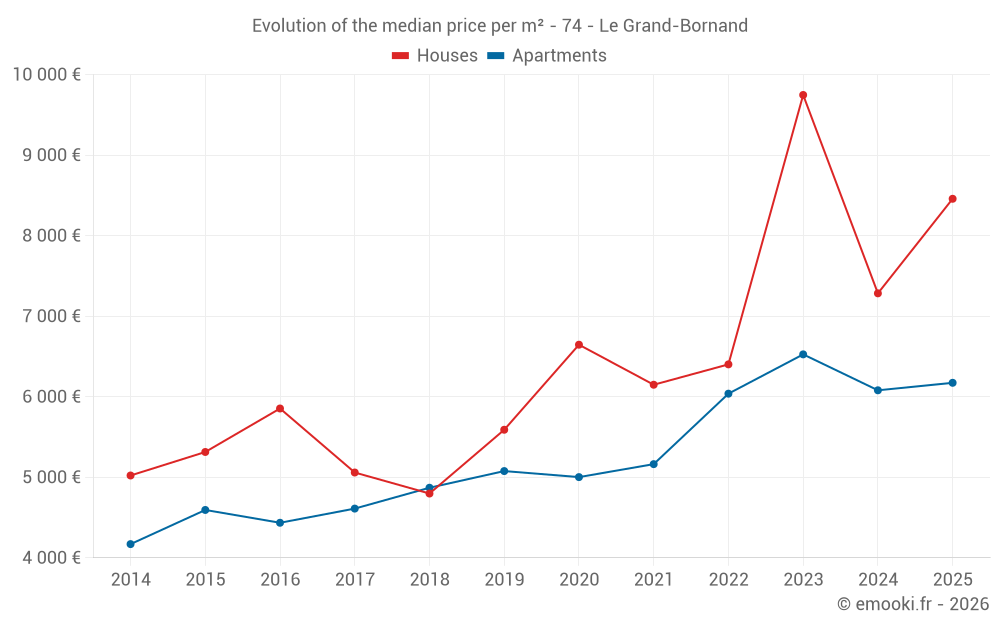
Median price of real estate
in the municipality of Le Grand-Bornand

HousesHouses
8 143  /m²
1-23-45-67-89-10
Reliability 7/10
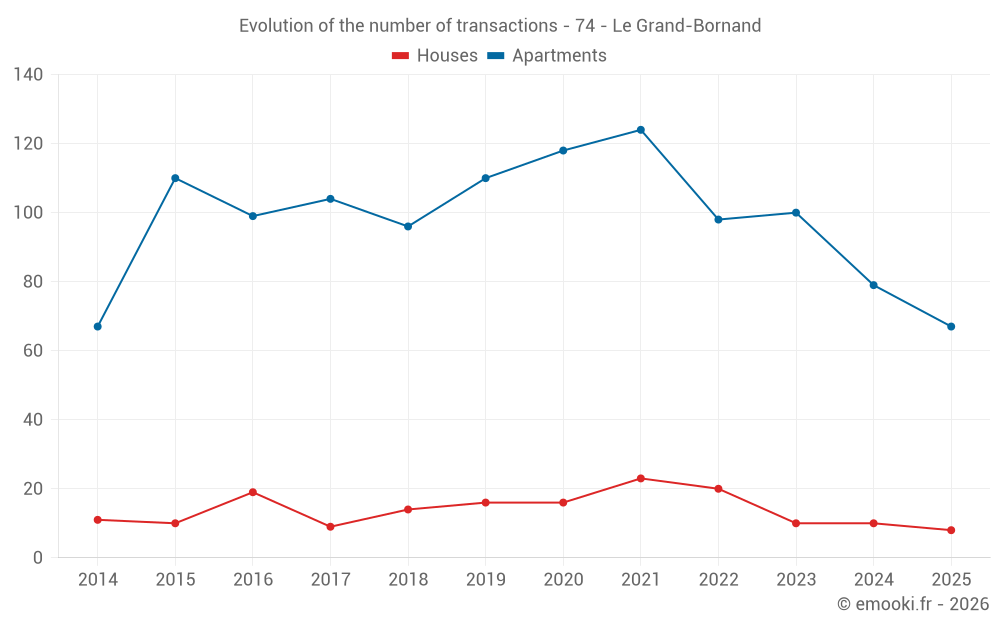
Median price on the 23 transactions of the last 24 months.
from 4 513 to
9 279  /m²
60% of transactions from the 2nd to the 8th deciles.
ApartmentsApartments
6 792  /m²
1-23-45-67-89-10
Reliability 10/10
Median price on the 30 transactions of the last 3 months.
from 4 999 to
7 478  /m²
60% of transactions from the 2nd to the 8th deciles.
DwellingsDwellings
6 792  /m²
1-23-45-67-89-10
Reliability 10/10
Median price on the 32 transactions of the last 3 months.
from 4 995 to
7 420  /m²
60% of transactions from the 2nd to the 8th deciles.
HousesEvolution of the price per m² of houses since...
1 year
+16%
2 years
-13%
3 years
+32%
4 years
+38%
5 years
+27%
6 years
+51%
7 years
+76%
8 years
+67%
9 years
+44%
10 years
+59%
11 years
+68%
The price per m² of houses has decreased by 13% since 2 years, but it has increased by 76% in 7 years.
ApartmentsEvolution of the price per m² of apartments since...
1 year
+1.5%
2 years
-5.4%
3 years
+2.2%
4 years
+20%
5 years
+23%
6 years
+22%
7 years
+27%
8 years
+34%
9 years
+39%
10 years
+34%
11 years
+48%
The price per m² of apartments has decreased by 5.4% since 2 years, but it has increased by 48% in 11 years.

Yearly evolution

Evolution of the median price per m²

Evolution of the median price per m² - 74 - Le Grand-Bornand

Evolution of the number of transactions

Warning, last year incomplete. Projections made based on the proportions between semesters of the previous year at the departmental/national level and by type of property.

Evolution of the number of transactions - 74 - Le Grand-Bornand

Yearly data

Descending order
Year
Houses
house
transactions
Houses
house
Price per m²
Apartments
apt.
transactions
Apartments
apt.
Price per m²
2025
8
8 458 
67
6 173 
2024
10
7 284 
79
6 080 
2023
10
9 747 
100
6 526 
2022
20
6 402 
98
6 038 
2021
23
6 149 
124
5 163 
2020
16
6 646 
118
5 002 
2019
16
5 590 
110
5 077 
2018
14
4 798 
96
4 870 
2017
9
5 059 
104
4 611 
2016
19
5 854 
99
4 435 
2015
10
5 314 
110
4 594 
2014
11
5 022 
67
4 170 

Analysis

Structure of prices per m²

Values of price percentiles per m² over the periods used for the estimated price of each type of property.

Structure of transaction amounts

Values of transaction amounts percentiles over the periods used for the estimated price of each type of property.

Transaction amounts and prices per m² by percentile

Ascending order
Percentile
Houses
house
Price per m²
Houses
house
Transaction amount
Apartments
apt.
Price per m²
Apartments
apt.
Transaction amount
10th percentile
3 941 
272 K
4 802 
128 K
20th percentile
4 513 
540 K
4 999 
142 K
30th percentile
6 057 
568 K
5 641 
168 K
40th percentile
7 755 
683 K
6 457 
204 K
50th percentile
8 143 
763 K
6 792 
267 K
60th percentile
8 546 
887 K
7 012 
335 K
70th percentile
8 764 
1 064 K
7 266 
357 K
80th percentile
9 279 
1 320 K
7 478 
392 K
90th percentile
12 979 
1 482 K
7 855 
557 K

National and departmental comparison

Evolution of the median price per m² of houses

Evolution of the median price per m² of apartments

Quarterly evolution

Evolution of the median price per m²

Evolution of the number of transactions

Quarterly data

Descending order
Quarter
Houses
house
transactions
Houses
house
Price per m²
Apartments
apt.
transactions
Apartments
apt.
Price per m²
2025 Q2
2
5 610 
30
6 792 
2025 Q1
6
9 027 
37
6 089 
2024 Q4
1
4 564 
20
5 833 
2024 Q3
5
8 281 
19
5 933 
2024 Q2
3
6 286 
15
6 224 
2024 Q1
1
8 532 
25
6 500 
2023 Q4
4
6 165 
28
6 164 
2023 Q3
1
10 219 
20
6 671 
2023 Q2
1
7 739 
30
6 544 
2023 Q1
4
12 974 
22
6 504 
2022 Q4
3
8 696 
27
6 333 
2022 Q3
5
3 750 
24
6 076 
2022 Q2
5
4 545 
19
5 854 
2022 Q1
7
7 595 
28
5 972 
2021 Q4
6
7 310 
34
5 968 
2021 Q3
9
5 152 
34
5 176 
2021 Q2
5
6 096 
24
4 758 
2021 Q1
3
5 585 
32
5 030 
2020 Q4
5
7 024 
43
4 885 
2020 Q3
5
6 500 
25
5 143 
2020 Q2
3
6 793 
25
5 020 
2020 Q1
3
6 344 
25
5 079 
2019 Q4
4
2 490 
38
5 177 
2019 Q3
1
5 630 
24
5 198 
2019 Q2
4
7 212 
29
5 096 
2019 Q1
7
6 573 
19
4 792 
2018 Q4
4
4 798 
29
4 658 
2018 Q3
6
6 318 
24
5 401 
2018 Q2
3
3 136 
30
4 921 
2018 Q1
1
18 333 
13
4 781 
2017 Q4
2
7 489 
28
4 666 
2017 Q3
4
6 696 
17
4 024 
2017 Q2
3
5 059 
37
4 629 
2017 Q1
0
--- 
22
4 780 
2016 Q4
2
10 346 
38
4 576 
2016 Q3
5
6 585 
26
4 352 
2016 Q2
8
6 003 
25
4 226 
2016 Q1
4
3 382 
10
4 424 
2015 Q4
2
4 621 
35
4 575 
2015 Q3
1
5 443 
34
4 706 
2015 Q2
4
5 750 
23
4 700 
2015 Q1
3
5 184 
18
4 328 
2014 Q4
2
4 276 
24
4 214 
2014 Q3
6
5 099 
15
4 050 
2014 Q2
1
1 407 
19
4 123 
2014 Q1
2
6 036 
9
4 310 

Overview of the latest real estate transactions

The following list is an anonymized overview of the latest transactions. For more details and to find all transactions, please use the map to view transactions by plot or the transaction search page for a search by criteria.

2025-06-27
166 500 
5 550  /m²(30 m²)
Sale
Apartments
Apartment
2 rooms
30 m2
2 outbuildings
2025-06-26
730 000 
5 840  /m²(125 m²)
Sale
Apartments
Apartment
3 rooms
43 m2
Apartments
Apartment
4 rooms
82 m2
1 outbuilding
Land
415 m2
-Sols
Land
552 m2
-Prés
Land
43 m2
-Sols
Land
642 m2
-Terres
2025-06-24
35 000 
354  /m²(99 m²)
Sale
Apartments
Apartment
3 rooms
99 m2
2025-06-24
624 490 
Sale
1 outbuilding
2025-06-24
569 854 
7 401  /m²(77 m²)
Sale
Apartments
Apartment
4 rooms
77 m2
1 outbuilding
2025-06-19
270 000 
8 438  /m²(32 m²)
Sale
1 outbuilding
Apartments
Apartment
2 rooms
32 m2
1 outbuilding
2025-06-17
182 753 
7 029  /m²(26 m²)
Sale
Apartments
Apartment
1 room
26 m2
1 outbuilding
2025-06-16
148 500 
7 425  /m²(20 m²)
Sale
Apartments
Apartment
1 room
20 m2
2 outbuildings
2025-06-16
450 720 
7 389  /m²(61 m²)
Sale
Apartments
Apartment
3 rooms
61 m2
2 outbuildings
2025-06-11
231 000 
8 250  /m²(28 m²)
Sale
Apartments
Apartment
2 rooms
28 m2
1 outbuilding
2025-06-11
324 000 
4 985  /m²(65 m²)
Sale
Commercial property
13 m2
Commercial property
52 m2
2025-06-11
556 000 
4 920  /m²(113 m²)
Sale
Commercial property
100 m2
Commercial property
13 m2
2025-06-05
129 000 
6 450  /m²(20 m²)
Sale
Apartments
Apartment
1 room
20 m2
2025-06-04
542 500 
3 848  /m²(141 m²)
Sale
Houses
House
5 rooms
141 m2
Land
691 m2
-Sols
Land
309 m2
-Terres
2025-06-03
345 000 
7 841  /m²(44 m²)
Sale
Apartments
Apartment
2 rooms
44 m2
1 outbuilding
2025-05-28
1 254 590 
6 745  /m²(186 m²)
Sale
Apartments
Apartment
3 rooms
75 m2
Apartments
Apartment
5 rooms
111 m2
Land
579 m2
-Sols
Land
109 m2
-Terres
2025-05-26
142 000 
5 680  /m²(25 m²)
Sale
Apartments
Apartment
1 room
25 m2
2 outbuildings
2025-05-26
700 
Sale
Land
68 m2
-Prés
2025-05-26
300 000 
5 769  /m²(52 m²)
Sale
Commercial property
52 m2
2025-05-22
351 330 
6 889  /m²(51 m²)
Sale
Apartments
Apartment
2 rooms
51 m2
1 outbuilding
2064 transactions listed in the municipality

Haute-Savoie (74)

Most expensive cities

City
name
Descending orderHouses
house
Price per m²
15 679 
13 070 
12 664 
12 078 
11 412 
11 019 
10 026 
9 621 
City
name
Descending orderApartments
apt.
Price per m²
9 603 
8 676 
8 394 
7 898 
7 778 
6 792 
6 625 
6 373 

Least expensive cities

City
name
Ascending orderHouses
house
Price per m²
2 070 
2 093 
2 300 
2 436 
2 611 
2 622 
2 709 
2 733 
City
name
Ascending orderApartments
apt.
Price per m²
725 
1 145 
1 250 
1 405 
1 448 
1 548 
1 628 
1 632 
1 674 
1 729