emooki
HomePrice mapTransactions
🇬🇧 English🇫🇷 Français🇩🇪 Deutsch🇪🇸 Español🇮🇹 Italiano

Real estate price map


Real estate price map in the municipality of Dingy-Saint-Clair, choose a section to see transactions by parcel.

Haute-Savoie (74)
Dingy-Saint-Clair

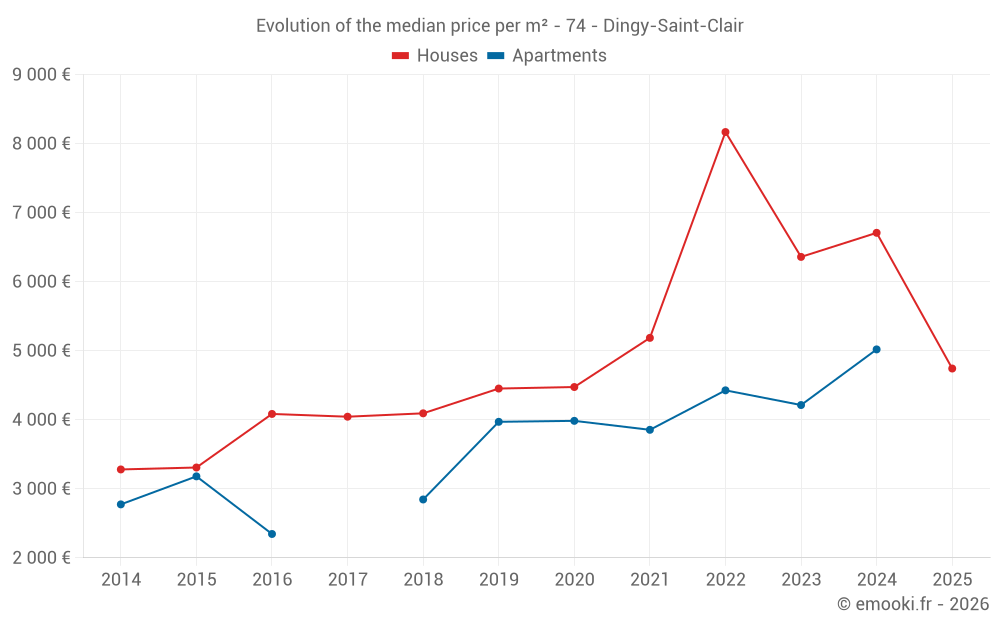
Median price of real estate
in the municipality of Dingy-Saint-Clair

HousesHouses
5 779 € /m²
1-23-45-67-89-10
Reliability 7/10
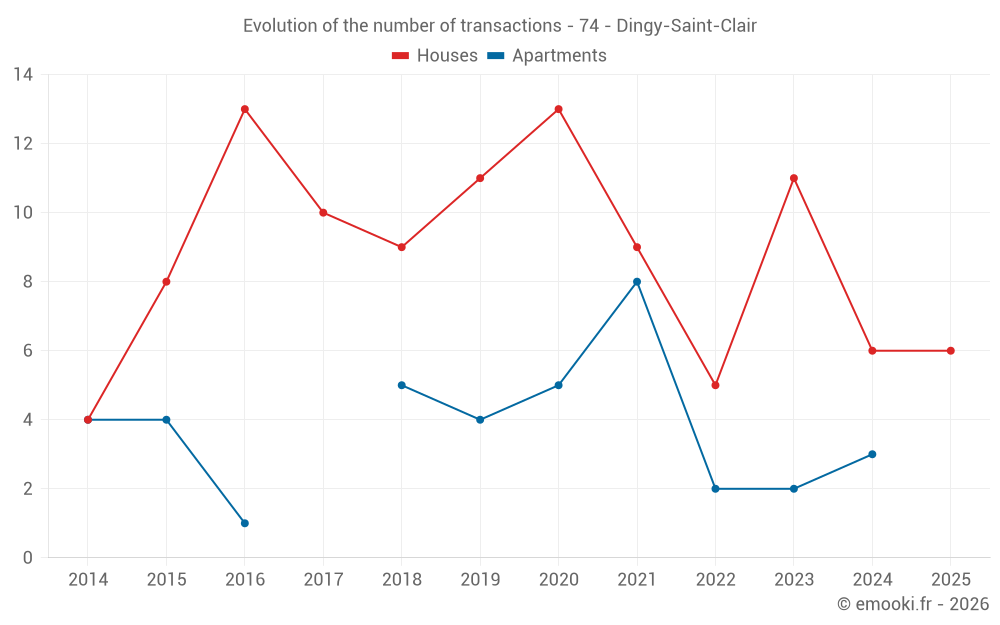
Median price on the 17 transactions of the last 24 months.
from 4 723 to
6 869 € /m²
60% of transactions from the 2nd to the 8th deciles.
ApartmentsApartments
4 097 € /m²
1-23-45-67-89-10
Reliability 5/10
Median price on the 13 transactions of the last 48 months.
from 3 425 to
4 957 € /m²
60% of transactions from the 2nd to the 8th deciles.
DwellingsDwellings
5 512 € /m²
1-23-45-67-89-10
Reliability 7/10
Median price on the 22 transactions of the last 24 months.
from 4 251 to
6 724 € /m²
60% of transactions from the 2nd to the 8th deciles.
HousesEvolution of the price per m² of houses since...
1 year
-29%
2 years
-25%
3 years
-42%
4 years
-8.6%
5 years
+6%
6 years
+6.5%
7 years
+16%
8 years
+17%
9 years
+16%
10 years
+43%
11 years
+45%
The price per m² of houses has decreased by 42% since 3 years, but it has increased by 45% in 11 years.

Yearly evolution

Evolution of the median price per m²

Evolution of the median price per m² - 74 - Dingy-Saint-Clair

Evolution of the number of transactions

Warning, last year incomplete. Projections made based on the proportions between semesters of the previous year at the departmental/national level and by type of property.

Evolution of the number of transactions - 74 - Dingy-Saint-Clair

Yearly data

Descending order
Year
Houses
house
transactions
Houses
house
Price per m²
Apartments
apt.
transactions
Apartments
apt.
Price per m²
2025
6
4 742 €
0
--- €
2024
6
6 708 €
3
5 019 €
2023
11
6 359 €
2
4 213 €
2022
5
8 168 €
2
4 426 €
2021
9
5 186 €
8
3 854 €
2020
13
4 474 €
5
3 984 €
2019
11
4 452 €
4
3 970 €
2018
9
4 093 €
5
2 845 €
2017
10
4 044 €
0
--- €
2016
13
4 084 €
1
2 345 €
2015
8
3 308 €
4
3 180 €
2014
4
3 280 €
4
2 774 €

Analysis

Structure of prices per m²

Values of price percentiles per m² over the periods used for the estimated price of each type of property.

Structure of transaction amounts

Values of transaction amounts percentiles over the periods used for the estimated price of each type of property.

Transaction amounts and prices per m² by percentile

Ascending order
Percentile
Houses
house
Price per m²
Houses
house
Transaction amount
Apartments
apt.
Price per m²
Apartments
apt.
Transaction amount
10th percentile
3 274 €
255 K€
2 626 €
176 K€
20th percentile
4 723 €
435 K€
3 425 €
230 K€
30th percentile
4 881 €
520 K€
3 865 €
266 K€
40th percentile
5 232 €
604 K€
3 957 €
289 K€
50th percentile
5 779 €
653 K€
4 097 €
295 K€
60th percentile
6 554 €
768 K€
4 523 €
307 K€
70th percentile
6 702 €
834 K€
4 798 €
354 K€
80th percentile
6 869 €
871 K€
4 957 €
469 K€
90th percentile
8 305 €
904 K€
5 451 €
574 K€

National and departmental comparison

Evolution of the median price per m² of houses

Evolution of the median price per m² of apartments

Quarterly evolution

Evolution of the median price per m²

Evolution of the number of transactions

Quarterly data

Descending order
Quarter
Houses
house
transactions
Houses
house
Price per m²
Apartments
apt.
transactions
Apartments
apt.
Price per m²
2025 Q2
2
4 424 €
0
--- €
2025 Q1
4
5 276 €
0
--- €
2024 Q4
3
6 904 €
0
--- €
2024 Q3
0
--- €
1
5 019 €
2024 Q2
3
6 684 €
1
2 488 €
2024 Q1
0
--- €
1
5 559 €
2023 Q4
2
24 013 €
1
2 426 €
2023 Q3
3
4 908 €
1
6 000 €
2023 Q2
2
8 532 €
0
--- €
2023 Q1
4
6 120 €
0
--- €
2022 Q4
3
8 168 €
1
4 097 €
2022 Q2
2
7 869 €
1
4 754 €
2021 Q4
4
4 714 €
5
3 969 €
2021 Q3
4
5 774 €
1
3 797 €
2021 Q2
0
--- €
1
3 215 €
2021 Q1
1
3 745 €
1
3 500 €
2020 Q4
5
4 244 €
1
4 633 €
2020 Q3
3
3 131 €
2
5 770 €
2020 Q2
3
5 465 €
1
2 844 €
2020 Q1
2
5 768 €
1
1 132 €
2019 Q4
1
4 452 €
0
--- €
2019 Q3
4
4 592 €
1
4 162 €
2019 Q2
2
3 150 €
2
3 192 €
2019 Q1
4
5 040 €
1
3 777 €
2018 Q4
3
4 195 €
1
2 315 €
2018 Q3
3
3 542 €
3
2 845 €
2018 Q2
1
1 750 €
1
3 236 €
2018 Q1
2
3 576 €
0
--- €
2017 Q4
3
4 707 €
0
--- €
2017 Q3
3
2 167 €
0
--- €
2017 Q2
3
3 974 €
0
--- €
2017 Q1
1
4 114 €
0
--- €
2016 Q4
4
3 662 €
1
2 345 €
2016 Q3
3
3 035 €
0
--- €
2016 Q2
3
3 805 €
0
--- €
2016 Q1
3
4 659 €
0
--- €
2015 Q4
2
2 931 €
0
--- €
2015 Q3
3
4 127 €
3
3 246 €
2015 Q2
2
4 898 €
1
2 797 €
2015 Q1
1
3 310 €
0
--- €
2014 Q4
0
--- €
2
2 774 €
2014 Q3
2
4 210 €
1
1 825 €
2014 Q2
1
3 583 €
0
--- €
2014 Q1
1
2 103 €
1
3 744 €

Overview of the latest real estate transactions

The following list is an anonymized overview of the latest transactions. For more details and to find all transactions, please use the map to view transactions by plot or the transaction search page for a search by criteria.

2025-06-04
934 798 €
4 136 € /m²(226 m²)
Sale
Houses
House
5 rooms
113 m2
Houses
House
5 rooms
113 m2
2025-05-12
1 800 €
Sale
Land
2402 m2
-Prés
2025-05-07
1 €
Sale
Land
57 m2
-Prés
Land
3 m2
-Prés
Land
200 m2
-Prés
2025-05-06
419 250 €
4 711 € /m²(89 m²)
Sale
Houses
House
6 rooms
89 m2
Land
232 m2
-Sols
Land
22 m2
-Sols
Land
307 m2
-Sols
2025-04-18
7 050 €
Sale
Land
141 m2
-Sols
2025-04-18
400 000 €
1 794 € /m²(223 m²)
8 163 € /m²(49 m²)
Sale
Houses
House
3 rooms
49 m2
Commercial property
174 m2
Land
160 m2
-Sols
Land
14180 m2
-Landes
/Rocs ou rochers
Land
259391 m2
-Taillis simples
Land
394317 m2
-Landes
/Rocs ou rochers
Land
339912 m2
-Landes
/Rocs ou rochers
Land
34792 m2
-Futaies mixtes
Land
2708 m2
-Futaies mixtes
Land
31053 m2
-Taillis simples
Land
21569 m2
-Pâtures
Land
6259 m2
-Landes
Land
5521 m2
-Landes
Land
89 m2
-Sols
Land
49596 m2
-Pâtures
Land
116316 m2
-Taillis simples
Land
79430 m2
-Landes
Land
275853 m2
-Taillis simples
Land
530821 m2
-Landes
/Rocs ou rochers
2025-04-08
87 000 €
Sale
Land
195 m2
-Sols
Land
59 m2
-Sols
2025-04-07
3 900 €
Exchange
Land
78 m2
-Prés
Land
78 m2
-Prés
2025-03-31
200 000 €
Sale
Land
257 m2
-Prés
Land
254 m2
-Prés
2025-03-31
855 730 €
8 822 € /m²(97 m²)
Sale
Houses
House
5 rooms
97 m2
Land
1000 m2
-Sols
Land
422 m2
-Terrains d'agrément
2025-03-04
2 000 €
Sale
Land
2215 m2
-Prés
Land
1074 m2
-Futaies mixtes
Land
6718 m2
-Futaies mixtes
Land
1370 m2
-Taillis sous futaie
Land
5141 m2
-Taillis simples
2025-02-28
525 000 €
4 773 € /m²(110 m²)
Sale
Houses
House
4 rooms
110 m2
Land
646 m2
-Sols
2025-02-13
393 000 €
Sale
Land
696 m2
-Terrains à bâtir
2025-01-20
653 000 €
5 779 € /m²(113 m²)
Sale
Houses
House
2 rooms
113 m2
Land
522 m2
-Sols
Land
653 m2
-Prés
2025-01-06
30 038 €
327 € /m²(92 m²)
Sale
Houses
House
5 rooms
92 m2
1 outbuilding
Land
1767 m2
-Sols
Land
128 m2
-Prés
2024-12-17
8 400 €
Sale
Land
12903 m2
-Futaies résineuses
2024-12-09
584 000 €
5 078 € /m²(115 m²)
Sale
Houses
House
5 rooms
115 m2
Land
1004 m2
-Sols
2024-11-28
317 €
Sale
Land
1 m2
-Sols
Land
2 m2
-Prés
Land
304 m2
-Prés
Land
10 m2
-Prés
2024-10-28
828 500 €
6 904 € /m²(120 m²)
Sale
Houses
House
3 rooms
120 m2
Land
1002 m2
-Sols
2024-10-28
1 500 €
Sale
Land
520 m2
-Taillis sous futaie
Land
205 m2
-Prés
424 transactions listed in the municipality

Haute-Savoie (74)

Most expensive cities

City
name
Descending orderHouses
house
Price per m²
15 679 €
14 387 €
13 070 €
12 664 €
12 078 €
11 412 €
11 019 €
10 026 €
9 621 €
9 458 €
City
name
Descending orderApartments
apt.
Price per m²
9 770 €
9 603 €
8 676 €
8 394 €
7 898 €
7 778 €
6 804 €
6 792 €
6 625 €
6 373 €

Least expensive cities

City
name
Ascending orderHouses
house
Price per m²
2 070 €
2 093 €
2 300 €
2 436 €
2 522 €
2 611 €
2 622 €
2 709 €
2 733 €
City
name
Ascending orderApartments
apt.
Price per m²
725 €
1 145 €
1 250 €
1 405 €
1 448 €
1 548 €
1 628 €
1 632 €
1 674 €
1 729 €