emooki
HomePrice mapTransactions
🇬🇧 English🇫🇷 Français🇩🇪 Deutsch🇪🇸 Español🇮🇹 Italiano

Real estate price map


Real estate price map in the municipality of Sallanches, choose a section to see transactions by parcel.

Haute-Savoie (74)

Sallanches - Real estate price m²

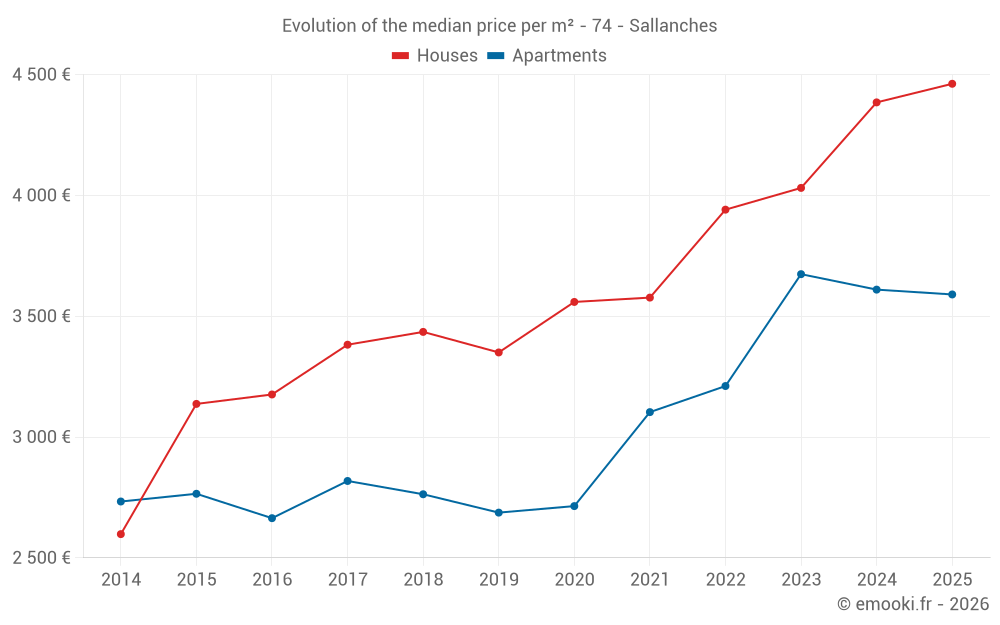
Median price of real estate
in the municipality of Sallanches

HousesHouses
4 462  /m²
1-23-45-67-89-10
Reliability 9/10
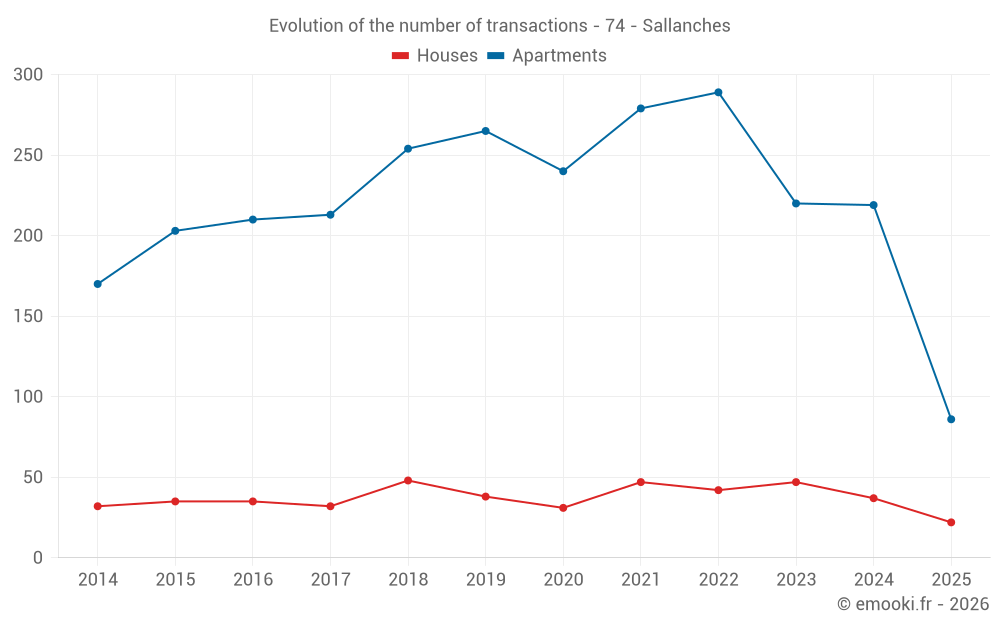
Median price on the 22 transactions of the last 6 months.
from 3 721 to
4 962  /m²
60% of transactions from the 2nd to the 8th deciles.
ApartmentsApartments
3 530  /m²
1-23-45-67-89-10
Reliability 10/10
Median price on the 24 transactions of the last 3 months.
from 2 770 to
4 695  /m²
60% of transactions from the 2nd to the 8th deciles.
DwellingsDwellings
3 720  /m²
1-23-45-67-89-10
Reliability 10/10
Median price on the 33 transactions of the last 3 months.
from 2 954 to
4 860  /m²
60% of transactions from the 2nd to the 8th deciles.
HousesEvolution of the price per m² of houses since...
1 year
+1.8%
2 years
+11%
3 years
+13%
4 years
+25%
5 years
+25%
6 years
+33%
7 years
+30%
8 years
+32%
9 years
+40%
10 years
+42%
11 years
+72%
ApartmentsEvolution of the price per m² of apartments since...
1 year
-0.6%
2 years
-2.3%
3 years
+12%
4 years
+16%
5 years
+32%
6 years
+34%
7 years
+30%
8 years
+27%
9 years
+35%
10 years
+30%
11 years
+31%
The price per m² of apartments has decreased by 2.3% since 2 years, but it has increased by 35% in 9 years.

Yearly evolution

Evolution of the median price per m²

Evolution of the median price per m² - 74 - Sallanches

Evolution of the number of transactions

Warning, last year incomplete. Projections made based on the proportions between semesters of the previous year at the departmental/national level and by type of property.

Evolution of the number of transactions - 74 - Sallanches

Yearly data

Descending order
Year
Houses
house
transactions
Houses
house
Price per m²
Apartments
apt.
transactions
Apartments
apt.
Price per m²
2025
22
4 462 
86
3 590 
2024
37
4 385 
219
3 610 
2023
47
4 031 
220
3 674 
2022
42
3 941 
289
3 211 
2021
47
3 577 
279
3 103 
2020
31
3 559 
240
2 714 
2019
38
3 350 
265
2 687 
2018
48
3 435 
254
2 763 
2017
32
3 382 
213
2 818 
2016
35
3 176 
210
2 664 
2015
35
3 137 
203
2 765 
2014
32
2 598 
170
2 733 

Analysis

Structure of prices per m²

Values of price percentiles per m² over the periods used for the estimated price of each type of property.

Structure of transaction amounts

Values of transaction amounts percentiles over the periods used for the estimated price of each type of property.

Transaction amounts and prices per m² by percentile

Ascending order
Percentile
Houses
house
Price per m²
Houses
house
Transaction amount
Apartments
apt.
Price per m²
Apartments
apt.
Transaction amount
10th percentile
3 655 
276 K
2 308 
103 K
20th percentile
3 721 
361 K
2 770 
128 K
30th percentile
3 973 
371 K
3 012 
135 K
40th percentile
4 355 
416 K
3 363 
147 K
50th percentile
4 462 
456 K
3 530 
153 K
60th percentile
4 761 
518 K
3 628 
173 K
70th percentile
4 819 
558 K
4 269 
177 K
80th percentile
4 962 
614 K
4 695 
214 K
90th percentile
5 155 
682 K
5 080 
247 K

National and departmental comparison

Evolution of the median price per m² of houses

Evolution of the median price per m² of apartments

Quarterly evolution

Evolution of the median price per m²

Evolution of the number of transactions

Quarterly data

Descending order
Quarter
Houses
house
transactions
Houses
house
Price per m²
Apartments
apt.
transactions
Apartments
apt.
Price per m²
2025 Q2
9
4 370 
24
3 530 
2025 Q1
13
4 500 
62
3 627 
2024 Q4
14
4 534 
63
3 702 
2024 Q3
9
5 592 
56
3 616 
2024 Q2
9
4 186 
51
3 618 
2024 Q1
5
5 167 
49
3 383 
2023 Q4
11
4 343 
42
3 724 
2023 Q3
15
4 234 
62
3 668 
2023 Q2
10
3 538 
51
3 730 
2023 Q1
11
5 230 
65
3 625 
2022 Q4
12
4 310 
72
3 216 
2022 Q3
9
4 126 
81
3 316 
2022 Q2
15
3 380 
84
3 190 
2022 Q1
6
4 541 
52
3 120 
2021 Q4
11
3 694 
61
3 119 
2021 Q3
13
3 740 
79
3 103 
2021 Q2
12
3 418 
78
3 164 
2021 Q1
11
3 210 
61
2 951 
2020 Q4
5
3 183 
72
2 849 
2020 Q3
12
3 432 
52
2 860 
2020 Q2
9
3 602 
60
2 646 
2020 Q1
5
3 184 
56
2 661 
2019 Q4
13
3 427 
72
2 801 
2019 Q3
13
3 172 
74
2 662 
2019 Q2
4
4 167 
74
2 654 
2019 Q1
8
2 894 
45
2 618 
2018 Q4
14
3 446 
65
2 716 
2018 Q3
12
3 320 
70
2 816 
2018 Q2
10
3 418 
72
2 614 
2018 Q1
12
3 508 
47
2 873 
2017 Q4
5
2 658 
50
2 768 
2017 Q3
11
3 544 
44
2 941 
2017 Q2
9
3 761 
65
2 823 
2017 Q1
7
3 287 
54
2 690 
2016 Q4
11
2 977 
53
2 653 
2016 Q3
14
3 321 
56
2 558 
2016 Q2
5
3 009 
53
2 877 
2016 Q1
5
3 176 
48
2 679 
2015 Q4
12
3 160 
59
2 681 
2015 Q3
10
3 487 
47
2 784 
2015 Q2
5
2 866 
53
2 907 
2015 Q1
8
3 149 
44
2 710 
2014 Q4
6
3 302 
36
2 899 
2014 Q3
9
2 603 
32
2 336 
2014 Q2
9
2 471 
49
2 724 
2014 Q1
8
2 396 
53
2 791 

Overview of the latest real estate transactions

The following list is an anonymized overview of the latest transactions. For more details and to find all transactions, please use the map to view transactions by plot or the transaction search page for a search by criteria.

2025-06-27
30 000 
Sale
1 outbuilding
2025-06-25
247 300 
3 637  /m²(68 m²)
Sale
2 outbuildings
Apartments
Apartment
3 rooms
68 m2
2025-06-18
100 300 
3 343  /m²(30 m²)
Sale
Apartments
Apartment
1 room
30 m2
1 outbuilding
2025-06-14
148 200 
3 024  /m²(49 m²)
Sale
Apartments
Apartment
2 rooms
49 m2
2 outbuildings
1 outbuilding
2025-06-13
14 000 
Sale
1 outbuilding
2025-06-12
135 000 
6 429  /m²(21 m²)
Sale
Apartments
Apartment
1 room
21 m2
1 outbuilding
1 outbuilding
2025-06-10
15 000 
Sale
1 outbuilding
2025-06-10
372 000 
3 720  /m²(100 m²)
Sale
Houses
House
3 rooms
100 m2
Land
559 m2
-Sols
Land
670 m2
-Terres
2025-06-10
475 000 
4 750  /m²(100 m²)
Sale
Houses
House
4 rooms
100 m2
1 outbuilding
Land
406 m2
-Sols
Land
394 m2
-Sols
2025-06-06
246 000 
2 321  /m²(106 m²)
Sale
Apartments
Apartment
5 rooms
106 m2
2025-06-05
173 500 
4 689  /m²(37 m²)
Sale
Apartments
Apartment
2 rooms
37 m2
1 outbuilding
1 outbuilding
2025-06-03
215 000 
3 162  /m²(68 m²)
Sale
Commercial property
40 m2
Commercial property
28 m2
2025-05-31
15 000 
Sale
1 outbuilding
2025-05-30
30 000 
Sale
1 outbuilding
2025-05-28
95 400 
3 975  /m²(24 m²)
Sale
Apartments
Apartment
1 room
24 m2
1 outbuilding
2025-05-28
63 000 
1 750  /m²(36 m²)
Sale
Commercial property
36 m2
2025-05-27
105 000 
2 838  /m²(37 m²)
Sale
Apartments
Apartment
2 rooms
37 m2
1 outbuilding
2025-05-26
216 000 
Sale
Land
800 m2
-Terres
Land
81 m2
-Terres
2025-05-22
102 500 
3 534  /m²(29 m²)
Sale
Apartments
Apartment
2 rooms
29 m2
2025-05-22
437 000 
4 370  /m²(100 m²)
Sale
Houses
House
4 rooms
100 m2
Land
22 m2
-Sols
Land
94 m2
-Sols
Land
212 m2
-Terres
5588 transactions listed in the municipality

Haute-Savoie (74)

Most expensive cities

City
name
Descending orderHouses
house
Price per m²
15 679 
13 070 
12 664 
12 078 
11 412 
11 019 
10 026 
9 621 
City
name
Descending orderApartments
apt.
Price per m²
9 603 
8 676 
8 394 
7 898 
7 778 
6 792 
6 625 
6 373 

Least expensive cities

City
name
Ascending orderHouses
house
Price per m²
2 070 
2 093 
2 300 
2 436 
2 611 
2 622 
2 709 
2 733 
City
name
Ascending orderApartments
apt.
Price per m²
725 
1 145 
1 250 
1 405 
1 448 
1 548 
1 628 
1 632 
1 674 
1 729