Real estate price map
Real estate price map in the municipality of Juvigny, choose a section to see transactions by parcel.
Haute-Savoie (74)
Price per m² in Juvigny
Median price of real estate
in the municipality of Juvigny
Houses
3 789 € /m²
Reliability 5/10
Median price on the 17 transactions of the last 48 months.
from 3 098 to
5 318 € /m²
5 318 € /m²
60% of transactions from the 2nd to the 8th deciles.
Apartments
3 532 € /m²
Reliability 4/10
Median price on the 10 transactions of the last 60 months.
Dwellings
3 672 € /m²
Reliability 6/10
Median price on the 13 transactions of the last 36 months.
from 3 119 to
4 389 € /m²
4 389 € /m²
60% of transactions from the 2nd to the 8th deciles.
Yearly evolution
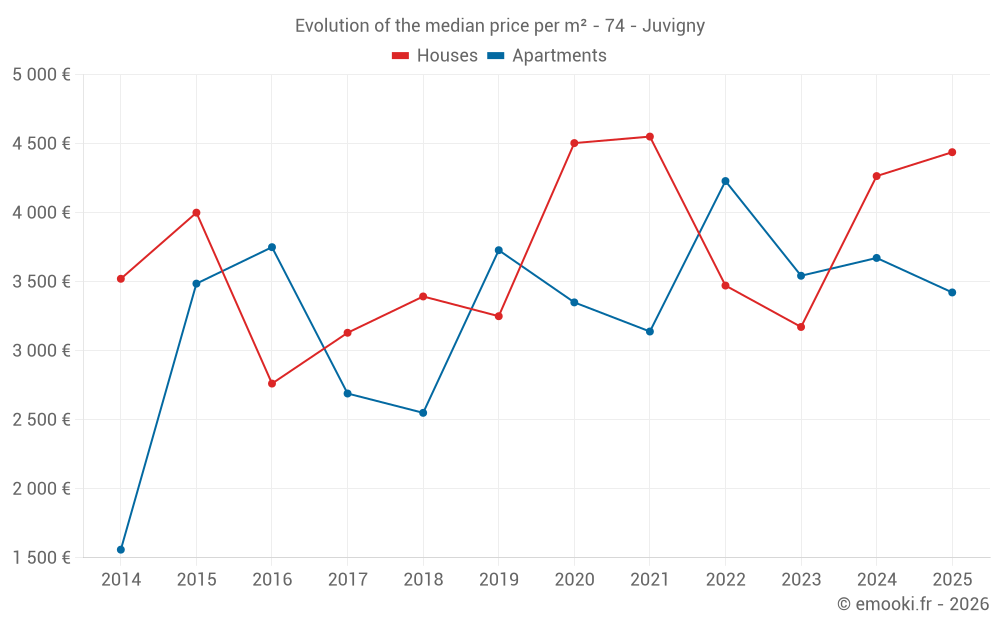
Evolution of the median price per m²
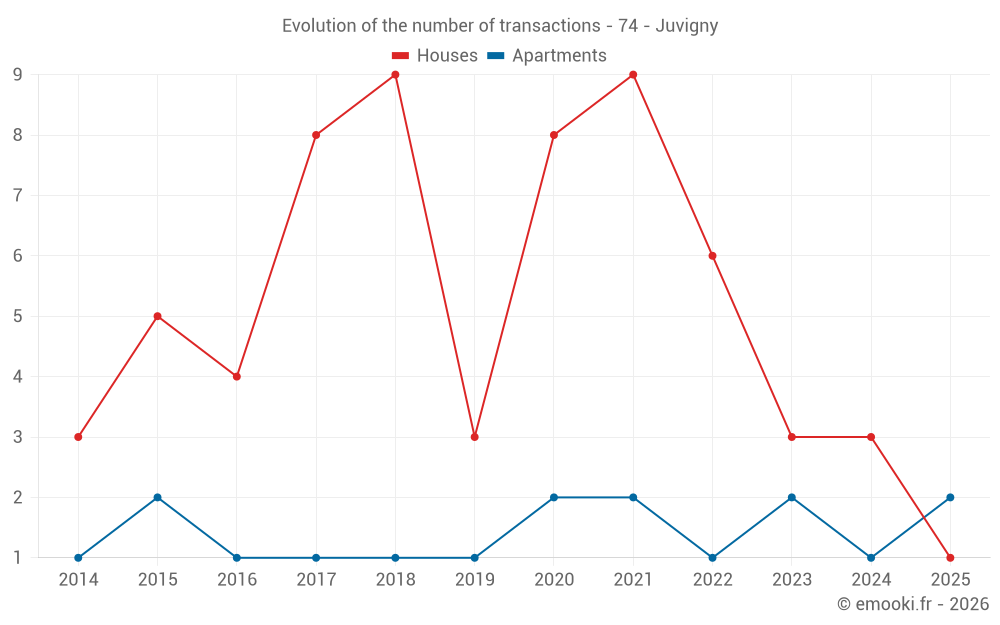
Evolution of the number of transactions
Warning, last year incomplete. Projections made based on the proportions between semesters of the previous year at the departmental/national level and by type of property.
Yearly data
Year
house
transactions
transactions
house
Price per m²
Price per m²
apt.
transactions
transactions
apt.
Price per m²
Price per m²
2025
1
4 438 €
2
3 422 €
2024
3
4 265 €
1
3 672 €
2023
3
3 172 €
2
3 543 €
2022
6
3 472 €
1
4 229 €
2021
9
4 551 €
2
3 139 €
2020
8
4 504 €
2
3 350 €
2019
3
3 250 €
1
3 728 €
2018
9
3 393 €
1
2 550 €
2017
8
3 130 €
1
2 690 €
2016
4
2 762 €
1
3 750 €
2015
5
4 000 €
2
3 486 €
2014
3
3 521 €
1
1 559 €
Analysis
Structure of prices per m²
Values of price percentiles per m² over the periods used for the estimated price of each type of property.
Structure of transaction amounts
Values of transaction amounts percentiles over the periods used for the estimated price of each type of property.
Transaction amounts and prices per m² by percentile
Percentile
house
Price per m²
Price per m²
house
Transaction amount
Transaction amount
apt.
Price per m²
Price per m²
apt.
Transaction amount
Transaction amount
10th percentile
2 904 €
311 K€
2 638 €
206 K€
20th percentile
3 098 €
346 K€
3 140 €
238 K€
30th percentile
3 169 €
414 K€
3 375 €
259 K€
40th percentile
3 274 €
446 K€
3 431 €
283 K€
50th percentile
3 789 €
473 K€
3 532 €
299 K€
60th percentile
4 222 €
511 K€
3 642 €
325 K€
70th percentile
4 461 €
561 K€
3 666 €
368 K€
80th percentile
5 318 €
607 K€
3 783 €
425 K€
90th percentile
5 839 €
681 K€
4 238 €
559 K€
National and departmental comparison
Evolution of the median price per m² of houses
Evolution of the median price per m² of apartments
Quarterly evolution
Evolution of the median price per m²
Evolution of the number of transactions
Quarterly data
Quarter
house
transactions
transactions
house
Price per m²
Price per m²
apt.
transactions
transactions
apt.
Price per m²
Price per m²
2025 Q1
1
4 438 €
2
3 422 €
2024 Q2
1
6 071 €
1
3 672 €
2024 Q1
2
3 674 €
0
--- €
2023 Q2
0
--- €
1
3 663 €
2023 Q1
3
3 172 €
1
3 423 €
2022 Q4
0
--- €
1
4 229 €
2022 Q2
3
2 989 €
0
--- €
2022 Q1
3
3 789 €
0
--- €
2021 Q4
2
4 380 €
0
--- €
2021 Q3
2
3 930 €
2
3 139 €
2021 Q2
3
4 578 €
0
--- €
2021 Q1
2
3 798 €
0
--- €
2020 Q4
4
4 862 €
0
--- €
2020 Q3
2
3 063 €
2
3 350 €
2020 Q2
2
4 235 €
0
--- €
2019 Q4
1
2 984 €
0
--- €
2019 Q3
1
3 800 €
0
--- €
2019 Q2
1
3 250 €
0
--- €
2019 Q1
0
--- €
1
3 728 €
2018 Q4
1
873 €
0
--- €
2018 Q3
5
3 549 €
0
--- €
2018 Q2
1
2 952 €
0
--- €
2018 Q1
2
3 386 €
1
2 550 €
2017 Q4
3
3 386 €
0
--- €
2017 Q3
1
2 857 €
0
--- €
2017 Q2
0
--- €
1
2 690 €
2017 Q1
4
3 492 €
0
--- €
2016 Q4
1
4 429 €
1
3 750 €
2016 Q3
1
3 725 €
0
--- €
2016 Q1
2
1 668 €
0
--- €
2015 Q4
1
4 239 €
1
2 571 €
2015 Q3
2
2 636 €
0
--- €
2015 Q2
1
4 000 €
0
--- €
2015 Q1
1
2 874 €
1
4 400 €
2014 Q4
1
3 242 €
0
--- €
2014 Q2
1
3 521 €
0
--- €
2014 Q1
1
5 842 €
1
1 559 €
Overview of the latest real estate transactions
The following list is an anonymized overview of the latest transactions. For more details and to find all transactions, please use the map to view transactions by plot or the transaction search page for a search by criteria.
2025-05-30
58 100 €Sale
Land
166 m2
-Prés plantes
2025-03-17
204 880 €2 529 € /m²(81 m²)
Sale
Apartment
3 rooms
81 m2
2 outbuildings
2025-03-11
1 496 000 €4 413 € /m²(339 m²)
Sale
Commercial property
339 m2
2025-03-10
245 980 €4 315 € /m²(57 m²)
Sale
Apartment
3 rooms
57 m2
2 outbuildings
2025-01-16
466 000 €4 438 € /m²(105 m²)
Sale
House
4 rooms
105 m2
Land
128 m2
-Sols
Land
40 m2
-Sols
2024-12-26
1 440 000 €Sale
Land
1186 m2
-Prés plantes
Land
2698 m2
-Terres
Land
2400 m2
-Sols
Land
7305 m2
-Prés plantes
2024-12-02
2 010 €Sale
Land
67 m2
-Terres
2024-12-02
360 €Sale
Land
12 m2
-Terres
2024-08-13
1 212 281 €Sale
Land
1186 m2
-Prés plantes
Land
2698 m2
-Terres
Land
2400 m2
-Sols
Land
7305 m2
-Prés plantes
2024-06-27
532 500 €3 672 € /m²(145 m²)
Sale
Apartment
5 rooms
145 m2
2 outbuildings
2024-06-25
340 000 €6 071 € /m²(56 m²)
Sale
House
3 rooms
56 m2
1 outbuilding
Land
1173 m2
-Vergers
Land
646 m2
-Sols
2024-03-06
493 500 €3 084 € /m²(160 m²)
Sale
House
6 rooms
160 m2
Land
344 m2
-Sols
Land
858 m2
-Prés
Land
432 m2
-Jardins
Land
19 m2
-Prés
2024-02-16
290 000 €4 265 € /m²(68 m²)
Sale
House
3 rooms
68 m2
1 outbuilding
Land
523 m2
-Sols
2023-12-27
6 633 €Sale
Land
2211 m2
-Terres
2023-12-06
2 400 €Sale
Land
80 m2
-Sols
2023-11-29
23 706 €Sale
Land
7902 m2
-Terres
2023-11-08
5 500 €Sale
Land
3250 m2
-Terres
Land
882 m2
-Prés
2023-10-20
1 350 €Sale
Land
15 m2
-Sols
2023-10-12
695 451 €Sale
Land
5426 m2
-Terres
Land
2440 m2
-Terres
2023-09-14
31 961 €Sale
Land
306 m2
-Prés
Land
8105 m2
-Terres
170 transactions listed in the municipality
Compare with neighboring municipalities
City
name
name
house
Price per m²
Price per m²
apt.
Price per m²
Price per m²
City information
Zip code
- 74100 JUVIGNY
Data source & update
- Latest publication of the property value request (DVF) database made available by the DGFiP on October 19, 2025, covering transactions up to 06/30/2025:
- Administrative/cadastral division as of September 1, 2025, and municipal movements as of January 1, 2025: