emooki
HomePrice mapTransactions
🇬🇧 English🇫🇷 Français🇩🇪 Deutsch🇪🇸 Español🇮🇹 Italiano

Real estate price map


Real estate price map in the municipality of Bellevaux, choose a section to see transactions by parcel.

Haute-Savoie (74)

Bellevaux - Real estate price m²

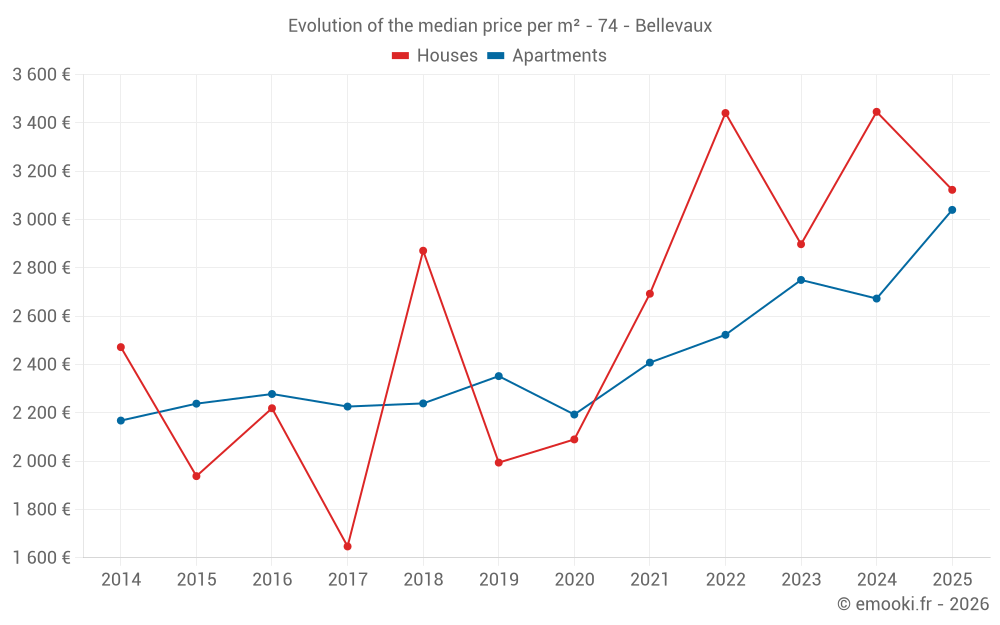
Median price of real estate
in the municipality of Bellevaux

HousesHouses
2 709  /m²
1-23-45-67-89-10
Reliability 7/10
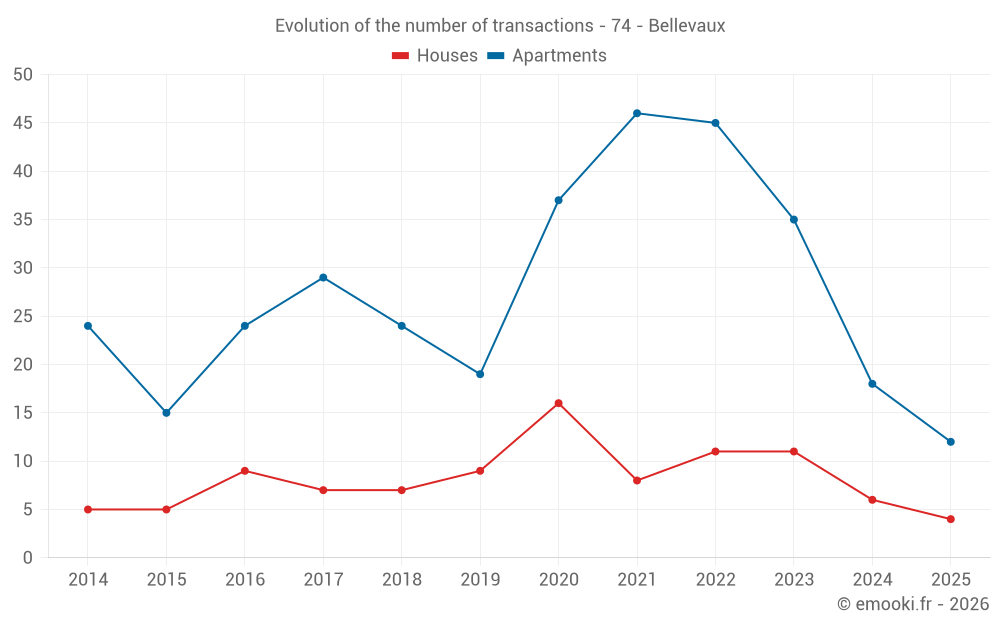
Median price on the 16 transactions of the last 24 months.
from 1 484 to
4 501  /m²
60% of transactions from the 2nd to the 8th deciles.
ApartmentsApartments
2 977  /m²
1-23-45-67-89-10
Reliability 8/10
Median price on the 23 transactions of the last 12 months.
from 2 636 to
3 241  /m²
60% of transactions from the 2nd to the 8th deciles.
DwellingsDwellings
2 977  /m²
1-23-45-67-89-10
Reliability 8/10
Median price on the 29 transactions of the last 12 months.
from 2 484 to
3 361  /m²
60% of transactions from the 2nd to the 8th deciles.
HousesEvolution of the price per m² of houses since...
1 year
-9.4%
2 years
+7.8%
3 years
-9.2%
4 years
+16%
5 years
+49%
6 years
+57%
7 years
+8.8%
8 years
+90%
9 years
+41%
10 years
+61%
11 years
+26%
The price per m² of houses has decreased by 9.4% since 1 year, but it has increased by 90% in 8 years.
ApartmentsEvolution of the price per m² of apartments since...
1 year
+14%
2 years
+11%
3 years
+20%
4 years
+26%
5 years
+39%
6 years
+29%
7 years
+36%
8 years
+37%
9 years
+33%
10 years
+36%
11 years
+40%

Yearly evolution

Evolution of the median price per m²

Evolution of the median price per m² - 74 - Bellevaux

Evolution of the number of transactions

Warning, last year incomplete. Projections made based on the proportions between semesters of the previous year at the departmental/national level and by type of property.

Evolution of the number of transactions - 74 - Bellevaux

Yearly data

Descending order
Year
Houses
house
transactions
Houses
house
Price per m²
Apartments
apt.
transactions
Apartments
apt.
Price per m²
2025
4
3 123 
12
3 040 
2024
6
3 446 
18
2 673 
2023
11
2 898 
35
2 750 
2022
11
3 441 
45
2 523 
2021
8
2 693 
46
2 408 
2020
16
2 090 
37
2 193 
2019
9
1 994 
19
2 352 
2018
7
2 871 
24
2 239 
2017
7
1 647 
29
2 226 
2016
9
2 219 
24
2 278 
2015
5
1 938 
15
2 238 
2014
5
2 472 
24
2 168 

Analysis

Structure of prices per m²

Values of price percentiles per m² over the periods used for the estimated price of each type of property.

Structure of transaction amounts

Values of transaction amounts percentiles over the periods used for the estimated price of each type of property.

Transaction amounts and prices per m² by percentile

Ascending order
Percentile
Houses
house
Price per m²
Houses
house
Transaction amount
Apartments
apt.
Price per m²
Apartments
apt.
Transaction amount
10th percentile
1 188 
107 K
2 423 
55 130 
20th percentile
1 484 
137 K
2 636 
64 608 
30th percentile
1 694 
185 K
2 746 
66 200 
40th percentile
2 105 
200 K
2 802 
71 280 
50th percentile
2 709 
260 K
2 977 
75 510 
60th percentile
3 766 
328 K
3 025 
78 794 
70th percentile
4 257 
399 K
3 199 
82 200 
80th percentile
4 501 
463 K
3 241 
102 K
90th percentile
4 848 
502 K
3 408 
142 K

National and departmental comparison

Evolution of the median price per m² of houses

Evolution of the median price per m² of apartments

Quarterly evolution

Evolution of the median price per m²

Evolution of the number of transactions

Quarterly data

Descending order
Quarter
Houses
house
transactions
Houses
house
Price per m²
Apartments
apt.
transactions
Apartments
apt.
Price per m²
2025 Q2
1
5 494 
4
2 998 
2025 Q1
3
2 105 
8
3 040 
2024 Q4
1
4 556 
7
2 669 
2024 Q3
1
1 184 
4
2 896 
2024 Q2
3
2 520 
2
2 932 
2024 Q1
1
4 373 
5
2 597 
2023 Q4
3
2 898 
15
2 713 
2023 Q3
3
1 810 
7
2 958 
2023 Q2
3
4 301 
7
2 811 
2023 Q1
2
1 704 
6
2 748 
2022 Q4
3
2 417 
10
2 544 
2022 Q3
4
2 946 
12
2 678 
2022 Q2
3
3 441 
13
2 435 
2022 Q1
1
5 208 
10
2 576 
2021 Q4
3
2 179 
16
2 426 
2021 Q3
4
2 810 
8
2 609 
2021 Q2
1
2 719 
12
2 393 
2021 Q1
0
--- 
10
2 294 
2020 Q4
4
2 646 
16
2 122 
2020 Q3
4
2 291 
13
2 273 
2020 Q2
5
1 913 
5
1 037 
2020 Q1
3
1 667 
3
2 360 
2019 Q4
5
1 994 
8
2 246 
2019 Q3
1
2 984 
3
2 375 
2019 Q2
1
1 860 
3
2 492 
2019 Q1
2
2 752 
5
2 465 
2018 Q4
2
3 225 
6
2 282 
2018 Q3
3
2 105 
7
2 346 
2018 Q2
2
2 683 
7
2 107 
2018 Q1
0
--- 
4
2 030 
2017 Q4
3
1 446 
4
2 122 
2017 Q3
2
2 824 
10
2 136 
2017 Q2
1
1 437 
8
2 568 
2017 Q1
1
1 657 
7
2 226 
2016 Q4
1
4 054 
7
2 166 
2016 Q3
2
2 508 
4
2 284 
2016 Q2
4
2 341 
11
2 310 
2016 Q1
2
718 
2
2 266 
2015 Q4
1
909 
4
2 124 
2015 Q3
2
2 285 
6
2 351 
2015 Q2
1
1 800 
3
2 581 
2015 Q1
1
2 116 
2
1 924 
2014 Q4
1
4 191 
1
1 338 
2014 Q3
2
2 109 
4
2 177 
2014 Q2
2
2 236 
10
2 179 
2014 Q1
0
--- 
9
2 188 

Overview of the latest real estate transactions

The following list is an anonymized overview of the latest transactions. For more details and to find all transactions, please use the map to view transactions by plot or the transaction search page for a search by criteria.

2025-06-24
54 900 
2 614  /m²(21 m²)
Sale
Apartments
Apartment
1 room
21 m2
1 outbuilding
2025-06-16
64 500 
2 804  /m²(23 m²)
Sale
Apartments
Apartment
2 rooms
23 m2
2025-06-03
4 200 
Sale
Land
810 m2
-Landes
Land
83 m2
-Landes
Land
7070 m2
-Futaies résineuses
Land
5830 m2
-Futaies feuillues
Land
1250 m2
-Futaies résineuses
Land
260 m2
-Terres
Land
351 m2
-Terres
Land
5810 m2
-Futaies résineuses
Land
450 m2
-Pâtures
Land
3275 m2
-Pâtures
Land
2610 m2
-Landes
2025-05-23
30 000 
Sale
Land
301 m2
-Sols
Land
54 m2
-Sols
Land
25 m2
-Sols
2025-05-22
53 000 
3 313  /m²(16 m²)
Sale
Apartments
Apartment
1 room
16 m2
1 outbuilding
2025-05-14
494 500 
5 494  /m²(90 m²)
Sale
Houses
House
5 rooms
90 m2
Land
1187 m2
-Sols
2025-05-13
2 276 
Sale
Land
2276 m2
-Terres
2025-04-28
21 150 
29  /m²(734 m²)
Sale
Commercial property
720 m2
Commercial property
14 m2
2025-04-23
1 840 
Sale
Land
920 m2
-Prés
2025-04-17
214 
Sale
Land
107 m2
-Terres
2025-04-17
915 
Sale
Land
1122 m2
-Futaies feuillues
2025-04-14
47 900 
3 193  /m²(15 m²)
Sale
Apartments
Apartment
1 room
15 m2
2025-04-04
1 000 
Exchange
Land
1143 m2
-Terres
Land
1143 m2
-Terres
2025-03-31
352 000 
4 141  /m²(85 m²)
Sale
Houses
House
4 rooms
85 m2
Land
975 m2
-Sols
Land
280 m2
-Sols
2025-03-31
200 000 
2 105  /m²(95 m²)
Sale
Houses
House
2 rooms
95 m2
Land
712 m2
-Sols
Land
1191 m2
-Prés
Land
656 m2
-Prés
2025-03-25
187 000 
3 740  /m²(50 m²)
Sale
Apartments
Apartment
2 rooms
50 m2
2025-03-21
104 450 
2 901  /m²(36 m²)
Sale
Apartments
Apartment
2 rooms
36 m2
2 outbuildings
2025-03-20
5 200 
Sale
Land
3742 m2
-Landes
2025-03-18
78 395 
3 015  /m²(26 m²)
Sale
Apartments
Apartment
2 rooms
26 m2
1 outbuilding
2025-03-07
137 160 
1 193  /m²(115 m²)
Sale
Houses
House
2 rooms
63 m2
Houses
House
3 rooms
52 m2
Land
3106 m2
-Prés
Land
1186 m2
-Sols
Land
1293 m2
-Taillis simples
Land
430 m2
-Landes
706 transactions listed in the municipality

Haute-Savoie (74)

Most expensive cities

City
name
Descending orderHouses
house
Price per m²
15 679 
13 070 
12 664 
12 078 
11 412 
11 019 
10 026 
9 621 
City
name
Descending orderApartments
apt.
Price per m²
9 603 
8 676 
8 394 
7 898 
7 778 
6 792 
6 625 
6 373 

Least expensive cities

City
name
Ascending orderHouses
house
Price per m²
2 070 
2 093 
2 300 
2 436 
2 611 
2 622 
2 709 
2 733 
City
name
Ascending orderApartments
apt.
Price per m²
725 
1 145 
1 250 
1 405 
1 448 
1 548 
1 628 
1 632 
1 674 
1 729