Real estate price map
Real estate price map in the municipality of La Côte-d'Arbroz, choose a section to see transactions by parcel.
Haute-Savoie (74)
Price per m² in La Côte-d'Arbroz
Median price of real estate
in the municipality of La Côte-d'Arbroz
Houses
6 522 € /m²
Reliability 6/10
Median price on the 20 transactions of the last 36 months.
from 4 712 to
8 585 € /m²
8 585 € /m²
60% of transactions from the 2nd to the 8th deciles.
Apartments
3 904 € /m²
Reliability 4/10
Median price on the 12 transactions of the last 60 months.
from 2 939 to
5 579 € /m²
5 579 € /m²
60% of transactions from the 2nd to the 8th deciles.
Dwellings
6 547 € /m²
Reliability 7/10
Median price on the 15 transactions of the last 24 months.
from 4 644 to
7 340 € /m²
7 340 € /m²
60% of transactions from the 2nd to the 8th deciles.
Yearly evolution
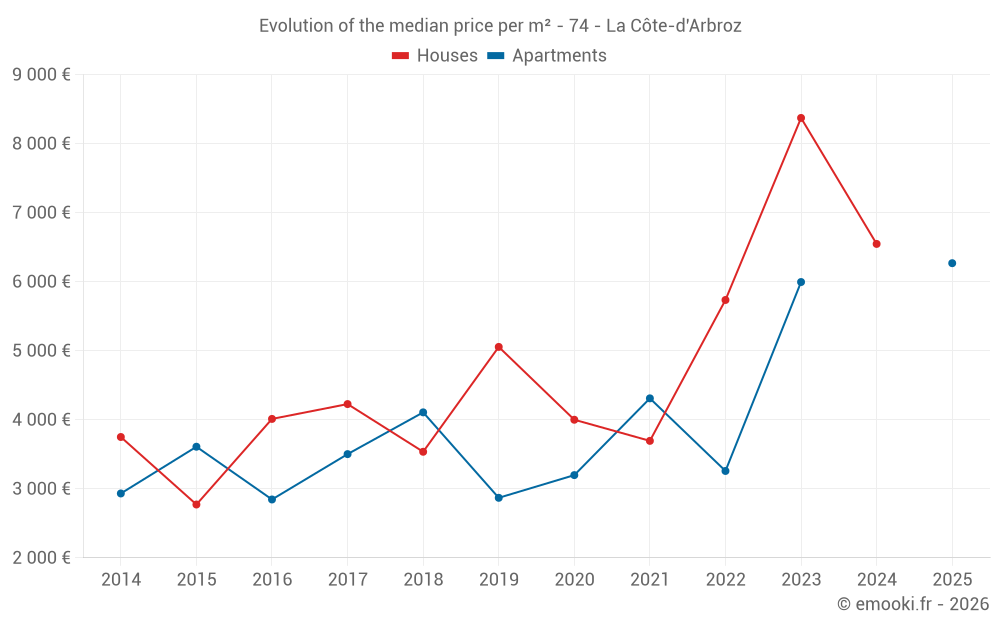
Evolution of the median price per m²
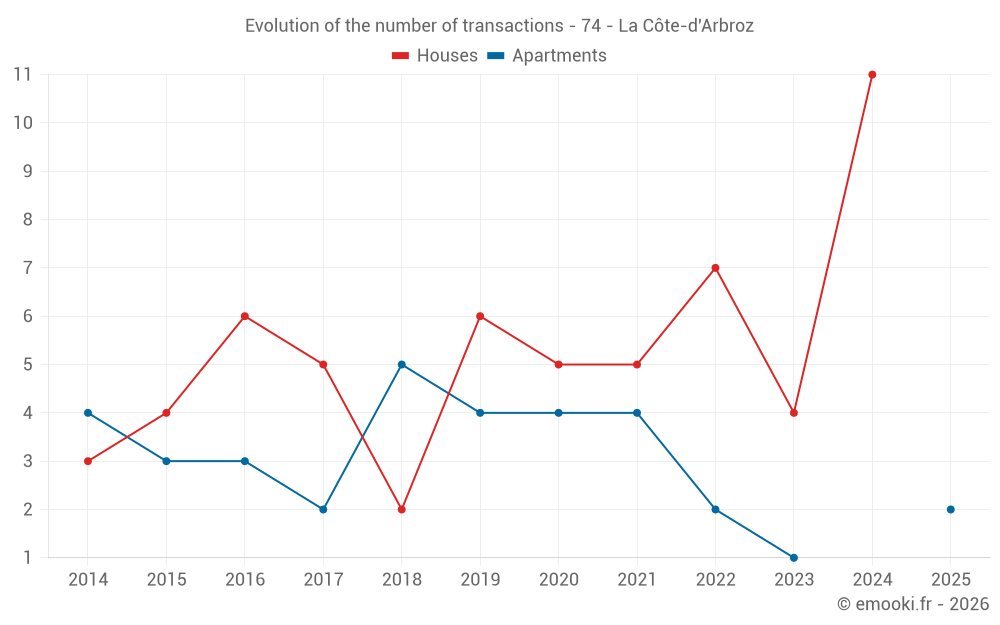
Evolution of the number of transactions
Warning, last year incomplete.
Yearly data
Year
house
transactions
transactions
house
Price per m²
Price per m²
apt.
transactions
transactions
apt.
Price per m²
Price per m²
2025
0
--- €
2
6 268 €
2024
11
6 547 €
0
--- €
2023
4
8 372 €
1
5 995 €
2022
7
5 735 €
2
3 258 €
2021
5
3 694 €
4
4 310 €
2020
5
4 000 €
4
3 198 €
2019
6
5 055 €
4
2 869 €
2018
2
3 536 €
5
4 107 €
2017
5
4 227 €
2
3 502 €
2016
6
4 012 €
3
2 845 €
2015
4
2 772 €
3
3 609 €
2014
3
3 750 €
4
2 932 €
Analysis
Structure of prices per m²
Values of price percentiles per m² over the periods used for the estimated price of each type of property.
Structure of transaction amounts
Values of transaction amounts percentiles over the periods used for the estimated price of each type of property.
Transaction amounts and prices per m² by percentile
Percentile
house
Price per m²
Price per m²
house
Transaction amount
Transaction amount
apt.
Price per m²
Price per m²
apt.
Transaction amount
Transaction amount
10th percentile
4 251 €
195 K€
2 776 €
126 K€
20th percentile
4 712 €
334 K€
2 939 €
137 K€
30th percentile
5 514 €
460 K€
3 142 €
155 K€
40th percentile
6 276 €
525 K€
3 634 €
180 K€
50th percentile
6 522 €
660 K€
3 904 €
208 K€
60th percentile
6 999 €
698 K€
4 385 €
234 K€
70th percentile
7 354 €
792 K€
5 183 €
259 K€
80th percentile
8 585 €
1 124 K€
5 579 €
709 K€
90th percentile
10 031 €
1 230 K€
5 958 €
1 113 K€
National and departmental comparison
Evolution of the median price per m² of houses
Evolution of the median price per m² of apartments
Quarterly evolution
Evolution of the median price per m²
Evolution of the number of transactions
Quarterly data
Quarter
house
transactions
transactions
house
Price per m²
Price per m²
apt.
transactions
transactions
apt.
Price per m²
Price per m²
2025 Q1
0
--- €
2
6 268 €
2024 Q4
2
3 776 €
0
--- €
2024 Q3
1
6 547 €
0
--- €
2024 Q2
6
6 651 €
0
--- €
2024 Q1
2
7 370 €
0
--- €
2023 Q3
1
10 307 €
1
5 995 €
2023 Q2
1
6 036 €
0
--- €
2023 Q1
2
8 514 €
0
--- €
2022 Q4
2
7 868 €
1
3 877 €
2022 Q3
3
5 000 €
0
--- €
2022 Q2
1
6 111 €
1
2 639 €
2022 Q1
1
5 650 €
0
--- €
2021 Q4
0
--- €
1
3 931 €
2021 Q3
2
5 537 €
2
4 198 €
2021 Q2
3
3 694 €
0
--- €
2021 Q1
0
--- €
1
4 688 €
2020 Q4
3
4 875 €
2
3 198 €
2020 Q3
0
--- €
1
2 759 €
2020 Q1
2
3 416 €
1
3 957 €
2019 Q4
1
5 250 €
0
--- €
2019 Q3
0
--- €
1
2 618 €
2019 Q2
3
4 860 €
2
2 786 €
2019 Q1
2
5 304 €
1
5 862 €
2018 Q4
0
--- €
3
4 214 €
2018 Q3
1
4 048 €
1
4 107 €
2018 Q1
1
3 025 €
1
2 614 €
2017 Q4
0
--- €
1
2 421 €
2017 Q3
2
4 252 €
0
--- €
2017 Q2
1
2 764 €
1
4 583 €
2017 Q1
2
3 340 €
0
--- €
2016 Q4
2
7 946 €
0
--- €
2016 Q3
0
--- €
1
2 845 €
2016 Q2
1
4 831 €
2
3 120 €
2016 Q1
3
3 120 €
0
--- €
2015 Q4
0
--- €
1
2 786 €
2015 Q3
3
2 219 €
1
5 066 €
2015 Q2
1
5 270 €
0
--- €
2015 Q1
0
--- €
1
3 609 €
2014 Q4
1
3 750 €
2
3 230 €
2014 Q3
1
5 115 €
0
--- €
2014 Q2
0
--- €
2
2 238 €
2014 Q1
1
2 300 €
0
--- €
Overview of the latest real estate transactions
The following list is an anonymized overview of the latest transactions. For more details and to find all transactions, please use the map to view transactions by plot or the transaction search page for a search by criteria.
2025-06-16
11 000 €Sale
Land
122 m2
-Prés
2025-05-21
1 053 632 €Sale
Land
711 m2
-Terres
2025-03-31
135 000 €5 625 € /m²(24 m²)
Sale
1 outbuilding
Apartment
2 rooms
24 m2
2025-01-30
1 720 900 €6 911 € /m²(249 m²)
Sale
Apartment
2 rooms
51 m2
Apartment
7 rooms
198 m2
2 outbuildings
Land
536 m2
-Sols
Land
79 m2
-Terres
Land
54 m2
-Terres
Land
70 m2
-Sols
Land
16 m2
-Sols
Land
219 m2
-Terres
Land
9 m2
-Terres
Land
9 m2
-Terres
Land
536 m2
-Terres
Land
1096 m2
-Terres
Land
12 m2
-Prés plantes
Land
508 m2
-Prés plantes
Land
31 m2
-Terres
2025-01-16
960 000 €Sale
Land
260 m2
-Terres
2024-12-12
5 000 €Sale
Land
2657 m2
-Prés
2024-11-26
3 500 €Sale
Land
616 m2
-Prés
Land
1357 m2
-Futaies résineuses
Land
347 m2
-Futaies résineuses
Land
110 m2
-Futaies résineuses
Land
1547 m2
-Futaies résineuses
Land
696 m2
-Prés
Land
1350 m2
-Pâtures
/Pâture plantée
Land
44 m2
-Taillis simples
Land
657 m2
-Prés
Land
525 m2
-Futaies résineuses
Land
1871 m2
-Prés
Land
686 m2
-Prés
Land
196 m2
-Prés
Land
2019 m2
-Terres
Land
907 m2
-Futaies résineuses
Land
4 m2
-Prés
Land
1568 m2
-Prés
Land
909 m2
-Terres
Land
1300 m2
-Landes
/Friche
Land
817 m2
-Futaies résineuses
Land
972 m2
-Prés
Land
532 m2
-Taillis simples
Land
825 m2
-Prés
Land
806 m2
-Prés
Land
252 m2
-Prés
Land
842 m2
-Prés
Land
1294 m2
-Prés
Land
1593 m2
-Prés
Land
1143 m2
-Prés
Land
1180 m2
-Futaies résineuses
Land
1098 m2
-Futaies résineuses
Land
1679 m2
-Prés
Land
374 m2
-Taillis simples
Land
1057 m2
-Prés
Land
2936 m2
-Prés
2024-11-21
280 000 €3 182 € /m²(88 m²)
Sale
House
3 rooms
88 m2
Land
328 m2
-Sols
Land
216 m2
-Terres
Land
291 m2
-Prés plantes
2024-11-12
786 600 €4 370 € /m²(180 m²)
Sale
House
6 rooms
180 m2
Land
311 m2
-Sols
Land
75 m2
-Terres
2024-10-10
573 €Exchange
Land
191 m2
-Landes
/Friche
Land
191 m2
-Taillis simples
2024-08-28
40 000 €Sale
Land
43 m2
-Prés
Land
1203 m2
-Prés
2024-08-23
1 486 €Sale
Land
743 m2
-Prés
2024-08-23
20 376 €Sale
Land
49 m2
-Prés
Land
120 m2
-Prés
Land
1199 m2
-Futaies résineuses
Land
1680 m2
-Terres
Land
68 m2
-Landes
/Friche
Land
141 m2
-Landes
/Friche
Land
2112 m2
-Terres
Land
963 m2
-Terres
Land
173 m2
-Prés
Land
447 m2
-Prés
Land
1451 m2
-Prés
Land
467 m2
-Prés
Land
1318 m2
-Prés
2024-08-23
2 388 €Sale
Land
1194 m2
-Futaies résineuses
2024-08-02
346 980 €6 547 € /m²(53 m²)
Sale
House
3 rooms
53 m2
Land
91 m2
-Sols
Land
39 m2
-Jardins
Land
127 m2
-Terres
Land
140 m2
-Jardins
2024-06-27
669 180 €6 497 € /m²(103 m²)
Sale
House
5 rooms
103 m2
Land
436 m2
-Sols
2024-06-21
95 000 €Sale
Land
16 m2
-Terres
Land
2 m2
-Terres
Land
122 m2
-Terres
Land
16 m2
-Terres
Land
182 m2
-Terres
Land
3 m2
-Terres
2024-06-18
285 000 €Sale
Land
1148 m2
-Terres
Land
226 m2
-Terres
Land
76 m2
-Landes
/Friche
2024-06-17
34 000 €Sale
Land
2182 m2
-Terres
Land
2908 m2
-Prés
Land
7573 m2
-Terres
2024-05-31
490 000 €7 313 € /m²(67 m²)
Sale
House
2 rooms
67 m2
273 transactions listed in the municipality
Compare with neighboring municipalities
City
name
name
house
Price per m²
Price per m²
apt.
Price per m²
Price per m²
City information
Zip code
- 74110 LA COTE D ARBROZ
Data source & update
- Latest publication of the property value request (DVF) database made available by the DGFiP on October 19, 2025, covering transactions up to 06/30/2025:
- Administrative/cadastral division as of September 1, 2025, and municipal movements as of January 1, 2025: