Real estate price map
Real estate price map in the municipality of Chênex, choose a section to see transactions by parcel.
Haute-Savoie (74)
Price per m² in Chênex
Median price of real estate
in the municipality of Chênex
Houses
4 202 € /m²
Reliability 5/10
Median price on the 20 transactions of the last 48 months.
from 3 189 to
5 474 € /m²
5 474 € /m²
60% of transactions from the 2nd to the 8th deciles.
Apartments
3 697 € /m²
Reliability 6/10
Median price on the 15 transactions of the last 36 months.
from 2 165 to
4 627 € /m²
4 627 € /m²
60% of transactions from the 2nd to the 8th deciles.
Dwellings
4 158 € /m²
Reliability 7/10
Median price on the 16 transactions of the last 24 months.
from 2 206 to
5 348 € /m²
5 348 € /m²
60% of transactions from the 2nd to the 8th deciles.
Yearly evolution
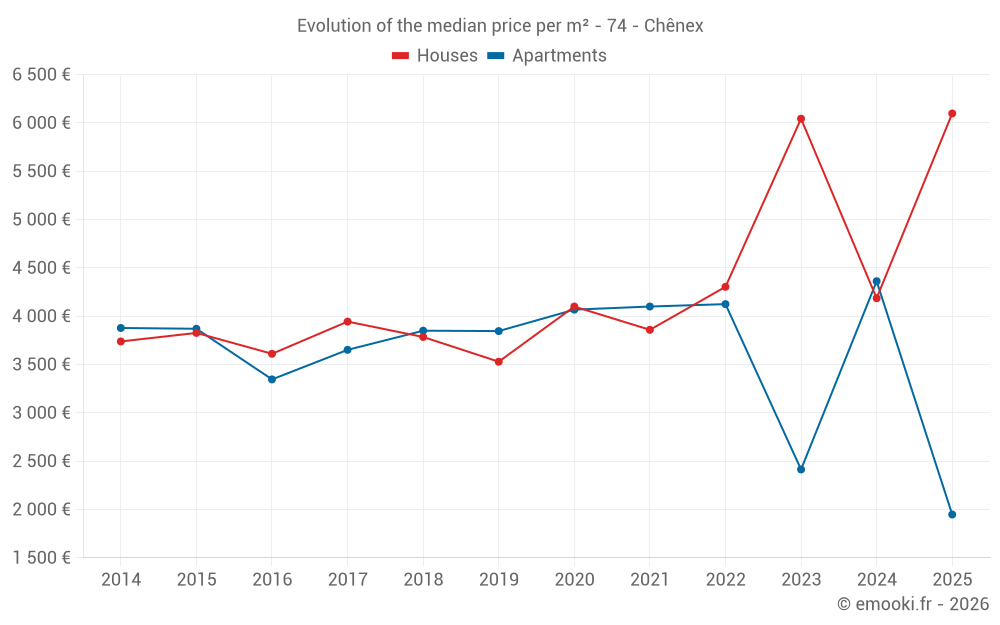
Evolution of the median price per m²
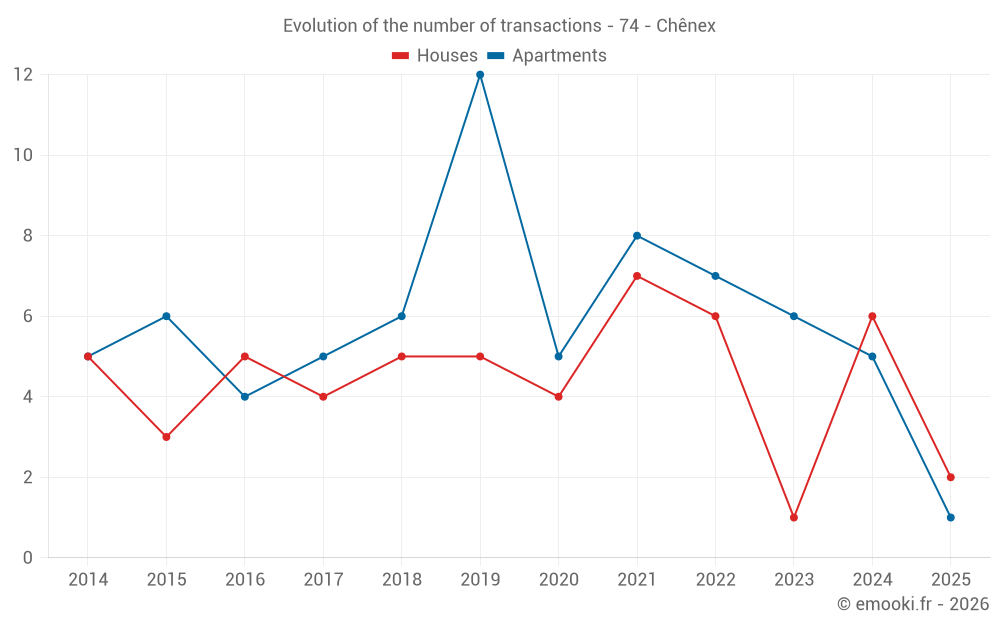
Evolution of the number of transactions
Warning, last year incomplete. Projections made based on the proportions between semesters of the previous year at the departmental/national level and by type of property.
Yearly data
Year
house
transactions
transactions
house
Price per m²
Price per m²
apt.
transactions
transactions
apt.
Price per m²
Price per m²
2025
2
6 098 €
1
1 948 €
2024
6
4 186 €
5
4 362 €
2023
1
6 044 €
6
2 414 €
2022
6
4 304 €
7
4 125 €
2021
7
3 859 €
8
4 100 €
2020
4
4 100 €
5
4 068 €
2019
5
3 529 €
12
3 846 €
2018
5
3 785 €
6
3 850 €
2017
4
3 944 €
5
3 652 €
2016
5
3 611 €
4
3 346 €
2015
3
3 827 €
6
3 870 €
2014
5
3 739 €
5
3 878 €
Analysis
Structure of prices per m²
Values of price percentiles per m² over the periods used for the estimated price of each type of property.
Structure of transaction amounts
Values of transaction amounts percentiles over the periods used for the estimated price of each type of property.
Transaction amounts and prices per m² by percentile
Percentile
house
Price per m²
Price per m²
house
Transaction amount
Transaction amount
apt.
Price per m²
Price per m²
apt.
Transaction amount
Transaction amount
10th percentile
2 542 €
342 K€
1 969 €
164 K€
20th percentile
3 189 €
385 K€
2 165 €
243 K€
30th percentile
3 926 €
425 K€
2 367 €
273 K€
40th percentile
4 015 €
440 K€
2 898 €
286 K€
50th percentile
4 202 €
465 K€
3 697 €
315 K€
60th percentile
4 372 €
511 K€
4 101 €
335 K€
70th percentile
5 013 €
551 K€
4 447 €
354 K€
80th percentile
5 474 €
576 K€
4 627 €
385 K€
90th percentile
6 053 €
604 K€
5 017 €
468 K€
National and departmental comparison
Evolution of the median price per m² of houses
Evolution of the median price per m² of apartments
Quarterly evolution
Evolution of the median price per m²
Evolution of the number of transactions
Quarterly data
Quarter
house
transactions
transactions
house
Price per m²
Price per m²
apt.
transactions
transactions
apt.
Price per m²
Price per m²
2025 Q2
1
5 348 €
0
--- €
2025 Q1
1
6 848 €
1
1 948 €
2024 Q4
1
1 548 €
4
4 415 €
2024 Q3
3
3 955 €
0
--- €
2024 Q2
1
4 418 €
1
3 927 €
2024 Q1
1
5 642 €
0
--- €
2023 Q4
0
--- €
2
1 924 €
2023 Q1
1
6 044 €
4
2 830 €
2022 Q4
1
4 342 €
2
3 596 €
2022 Q3
1
4 047 €
1
4 585 €
2022 Q2
3
4 265 €
1
3 974 €
2022 Q1
1
6 135 €
3
4 125 €
2021 Q4
3
3 859 €
1
4 311 €
2021 Q3
2
3 591 €
5
4 071 €
2021 Q2
1
3 468 €
1
4 249 €
2021 Q1
1
4 599 €
1
3 750 €
2020 Q4
2
3 098 €
0
--- €
2020 Q2
2
5 346 €
3
4 282 €
2020 Q1
0
--- €
2
3 909 €
2019 Q4
0
--- €
4
3 732 €
2019 Q3
3
3 827 €
3
4 224 €
2019 Q2
1
1 719 €
4
3 695 €
2019 Q1
1
3 529 €
1
3 829 €
2018 Q4
2
3 762 €
3
3 888 €
2018 Q3
1
3 890 €
1
3 733 €
2018 Q2
2
3 994 €
1
4 113 €
2018 Q1
0
--- €
1
3 654 €
2017 Q4
1
4 778 €
0
--- €
2017 Q3
1
1 496 €
2
3 916 €
2017 Q2
0
--- €
2
3 939 €
2017 Q1
2
3 944 €
1
3 496 €
2016 Q4
2
3 016 €
0
--- €
2016 Q3
1
4 587 €
2
2 951 €
2016 Q2
2
3 654 €
0
--- €
2016 Q1
0
--- €
2
3 648 €
2015 Q4
3
3 827 €
0
--- €
2015 Q3
0
--- €
2
4 084 €
2015 Q2
0
--- €
1
1 552 €
2015 Q1
0
--- €
3
3 740 €
2014 Q4
1
3 940 €
1
3 683 €
2014 Q3
2
3 496 €
0
--- €
2014 Q2
1
3 739 €
3
3 878 €
2014 Q1
1
3 182 €
1
4 810 €
Overview of the latest real estate transactions
The following list is an anonymized overview of the latest transactions. For more details and to find all transactions, please use the map to view transactions by plot or the transaction search page for a search by criteria.
2025-06-05
534 800 €5 348 € /m²(100 m²)
Sale
1 outbuilding
House
5 rooms
100 m2
Land
367 m2
-Sols
2025-03-31
630 000 €6 848 € /m²(92 m²)
Sale
House
4 rooms
92 m2
Land
668 m2
-Sols
2025-03-31
106 000 €Sale
Land
650 m2
-Sols
2025-03-07
9 364 €Sale
Land
6043 m2
-Prés plantes
Land
5662 m2
-Sols
2025-02-28
124 700 €1 948 € /m²(64 m²)
Sale
Apartment
3 rooms
64 m2
3 outbuildings
2025-02-13
75 000 €Sale
Land
19 m2
-Terrains à bâtir
Land
5 m2
-Terrains à bâtir
Land
1042 m2
-Prés
Land
172 m2
-Sols
2024-12-19
315 000 €5 164 € /m²(61 m²)
Sale
Apartment
3 rooms
61 m2
3 outbuildings
2024-12-11
200 €Sale
Land
3893 m2
-Taillis simples
2024-11-20
470 150 €1 175 € /m²(400 m²)
Sale
Commercial property
400 m2
2024-11-13
732 000 €3 697 € /m²(198 m²)
Sale
Apartment
4 rooms
131 m2
Apartment
3 rooms
67 m2
7 outbuildings
Land
1153 m2
-Sols
Land
999 m2
-Jardins
2024-11-13
227 603 €1 548 € /m²(147 m²)
Sale
House
5 rooms
147 m2
Land
271 m2
-Sols
Land
150 m2
-Sols
Land
482 m2
-Sols
Land
137 m2
-Sols
2024-10-31
379 490 €4 362 € /m²(87 m²)
Sale
Apartment
4 rooms
87 m2
1 outbuilding
2024-10-25
272 550 €4 468 € /m²(61 m²)
Sale
Apartment
3 rooms
61 m2
2 outbuildings
2024-10-24
14 000 €Sale
1 outbuilding
2024-09-24
435 000 €3 955 € /m²(110 m²)
Sale
House
6 rooms
110 m2
Land
1000 m2
-Sols
2024-09-04
400 000 €3 226 € /m²(124 m²)
Sale
House
5 rooms
124 m2
Land
370 m2
-Sols
Land
1174 m2
-Sols
2024-08-26
240 000 €Sale
Land
85 m2
-Prés
Land
277 m2
-Sols
2024-07-18
472 550 €5 432 € /m²(87 m²)
Sale
House
5 rooms
87 m2
1 outbuilding
Land
331 m2
-Sols
Land
484 m2
-Sols
2024-07-16
10 000 €Sale
Land
11 m2
-Sols
Land
19 m2
-Sols
2024-04-26
1 €Sale
Land
77 m2
-Sols
231 transactions listed in the municipality
Compare with neighboring municipalities
City
name
name
house
Price per m²
Price per m²
apt.
Price per m²
Price per m²
City information
Zip code
- 74520 CHENEX
Data source & update
- Latest publication of the property value request (DVF) database made available by the DGFiP on October 19, 2025, covering transactions up to 06/30/2025:
- Administrative/cadastral division as of September 1, 2025, and municipal movements as of January 1, 2025: