emooki
HomePrice mapTransactions
🇬🇧 English🇫🇷 Français🇩🇪 Deutsch🇪🇸 Español🇮🇹 Italiano

Real estate price map


Real estate price map in the municipality of Bogève.

Haute-Savoie (74)
Bogève

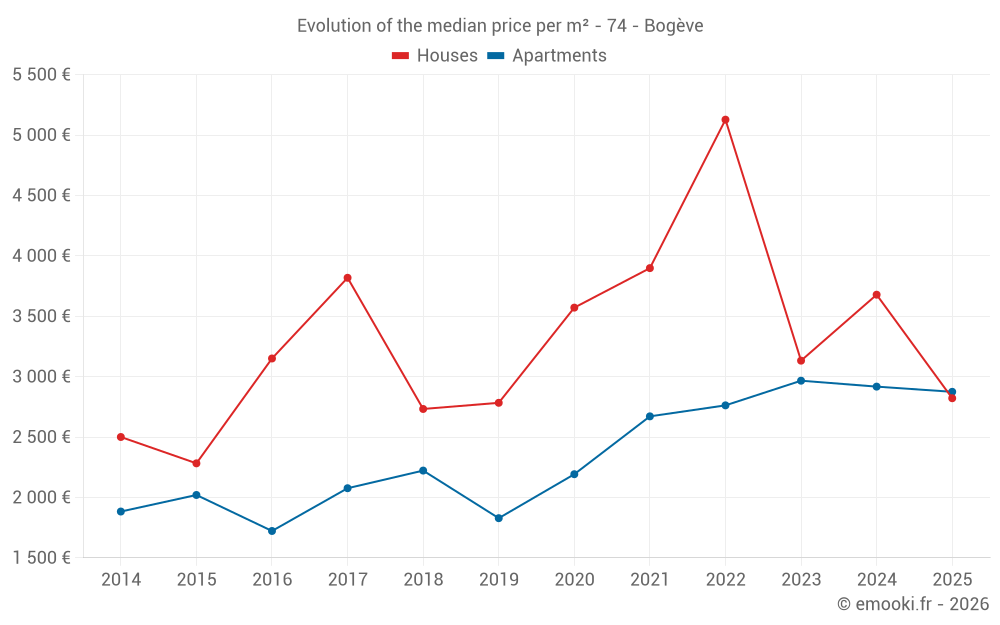
Median price of real estate
in the municipality of Bogève

HousesHouses
3 132  /m²
1-23-45-67-89-10
Reliability 7/10
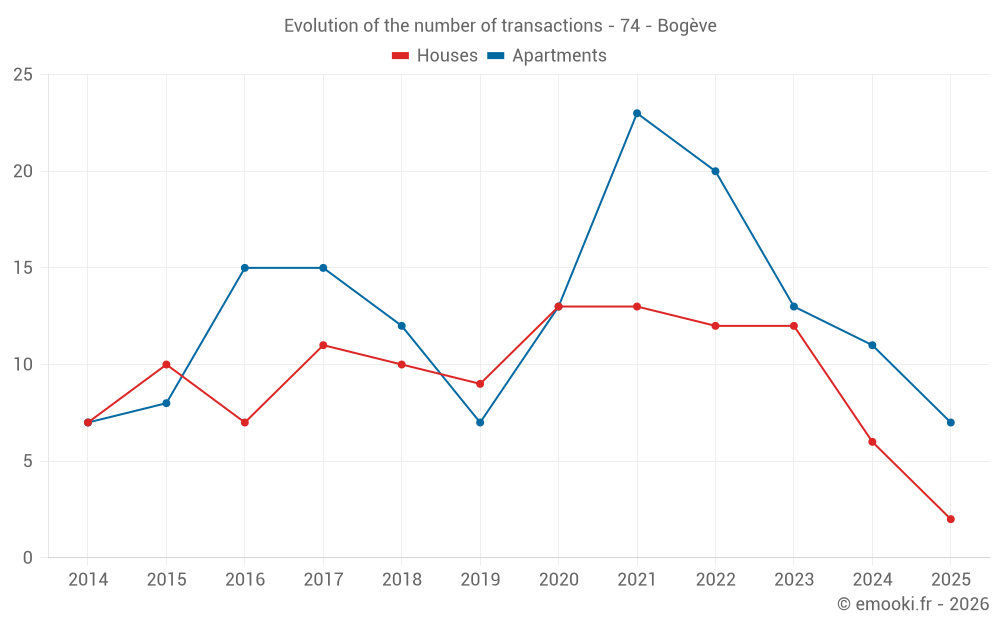
Median price on the 14 transactions of the last 24 months.
from 2 381 to
4 425  /m²
60% of transactions from the 2nd to the 8th deciles.
ApartmentsApartments
2 860  /m²
1-23-45-67-89-10
Reliability 7/10
Median price on the 24 transactions of the last 24 months.
from 2 156 to
3 266  /m²
60% of transactions from the 2nd to the 8th deciles.
DwellingsDwellings
2 982  /m²
1-23-45-67-89-10
Reliability 8/10
Median price on the 18 transactions of the last 12 months.
from 2 435 to
3 740  /m²
60% of transactions from the 2nd to the 8th deciles.
HousesEvolution of the price per m² of houses since...
1 year
--
2 years
--
3 years
--
4 years
--
5 years
--
6 years
--
7 years
--
8 years
--
9 years
--
10 years
--
11 years
--
ApartmentsEvolution of the price per m² of apartments since...
1 year
-1.5%
2 years
-3.1%
3 years
+4.1%
4 years
+7.6%
5 years
+31%
6 years
+57%
7 years
+29%
8 years
+38%
9 years
+67%
10 years
+42%
11 years
+53%

Yearly evolution

Evolution of the median price per m²

Evolution of the number of transactions

Warning, last year incomplete. Projections made based on the proportions between semesters of the previous year at the departmental/national level and by type of property.

Yearly data

Descending order
Year
Houses
house
transactions
Houses
house
Price per m²
Apartments
apt.
transactions
Apartments
apt.
Price per m²
2025
2
2 821 
7
2 874 
2024
6
3 678 
11
2 917 
2023
12
3 132 
13
2 966 
2022
12
5 127 
20
2 762 
2021
13
3 898 
23
2 671 
2020
13
3 571 
13
2 192 
2019
9
2 783 
7
1 828 
2018
10
2 732 
12
2 222 
2017
11
3 818 
15
2 076 
2016
7
3 150 
15
1 722 
2015
10
2 282 
8
2 020 
2014
7
2 500 
7
1 883 

Analysis

Structure of prices per m²

Values of price percentiles per m² over the periods used for the estimated price of each type of property.

Structure of transaction amounts

Values of transaction amounts percentiles over the periods used for the estimated price of each type of property.

Transaction amounts and prices per m² by percentile

Ascending order
Percentile
Houses
house
Price per m²
Houses
house
Transaction amount
Apartments
apt.
Price per m²
Apartments
apt.
Transaction amount
10th percentile
1 459 
110 K
1 958 
37 935 
20th percentile
2 381 
172 K
2 156 
49 400 
30th percentile
2 739 
214 K
2 587 
54 878 
40th percentile
2 837 
253 K
2 786 
60 240 
50th percentile
3 132 
273 K
2 860 
66 618 
60th percentile
3 371 
280 K
2 901 
75 541 
70th percentile
4 010 
280 K
3 064 
105 K
80th percentile
4 425 
298 K
3 266 
111 K
90th percentile
4 729 
425 K
3 745 
210 K

National and departmental comparison

Evolution of the median price per m² of houses

Evolution of the median price per m² of apartments

Quarterly evolution

Evolution of the median price per m²

Evolution of the number of transactions

Quarterly data

Descending order
Quarter
Houses
house
transactions
Houses
house
Price per m²
Apartments
apt.
transactions
Apartments
apt.
Price per m²
2025 Q2
1
887 
1
2 874 
2025 Q1
1
4 755 
6
3 019 
2024 Q4
1
2 368 
5
3 056 
2024 Q3
1
4 667 
2
2 540 
2024 Q2
2
2 222 
1
2 917 
2024 Q1
2
4 123 
3
2 058 
2023 Q4
3
2 907 
4
2 644 
2023 Q3
3
2 778 
2
2 267 
2023 Q2
4
5 286 
4
3 281 
2023 Q1
2
2 403 
3
3 056 
2022 Q4
3
5 406 
5
2 997 
2022 Q3
5
7 355 
6
2 228 
2022 Q2
2
5 440 
4
3 197 
2022 Q1
2
2 998 
5
2 500 
2021 Q4
3
3 898 
5
2 944 
2021 Q3
3
4 202 
7
2 970 
2021 Q2
4
4 908 
7
1 838 
2021 Q1
3
3 774 
4
2 076 
2020 Q4
3
3 571 
0
--- 
2020 Q3
3
2 634 
1
5 588 
2020 Q2
3
3 910 
6
2 216 
2020 Q1
4
3 860 
6
1 971 
2019 Q4
3
2 783 
4
1 840 
2019 Q3
3
2 143 
1
1 828 
2019 Q2
0
--- 
2
2 141 
2019 Q1
3
3 455 
0
--- 
2018 Q4
1
2 500 
4
2 192 
2018 Q3
3
2 661 
3
2 361 
2018 Q2
4
3 136 
4
1 611 
2018 Q1
2
630 
1
2 586 
2017 Q4
4
3 500 
7
2 595 
2017 Q3
1
6 109 
4
1 832 
2017 Q2
4
2 866 
1
1 583 
2017 Q1
2
5 688 
3
2 167 
2016 Q4
1
2 400 
3
1 625 
2016 Q3
3
3 214 
3
3 058 
2016 Q2
2
2 665 
6
1 703 
2016 Q1
1
2 179 
3
2 137 
2015 Q4
5
2 931 
3
2 310 
2015 Q2
3
1 731 
2
1 698 
2015 Q1
2
2 896 
3
2 151 
2014 Q4
1
2 303 
1
2 548 
2014 Q3
2
3 496 
3
2 315 
2014 Q2
2
2 643 
0
--- 
2014 Q1
2
1 977 
3
1 500 

Haute-Savoie (74)

Most expensive cities

City
name
Descending orderHouses
house
Price per m²
15 679 
13 070 
12 664 
12 078 
11 412 
11 019 
10 026 
9 621 
City
name
Descending orderApartments
apt.
Price per m²
9 603 
8 676 
8 394 
7 898 
7 778 
6 792 
6 625 
6 373 

Least expensive cities

City
name
Ascending orderHouses
house
Price per m²
2 070 
2 093 
2 300 
2 436 
2 611 
2 622 
2 709 
2 733 
City
name
Ascending orderApartments
apt.
Price per m²
725 
1 145 
1 250 
1 405 
1 448 
1 548 
1 628 
1 632 
1 674 
1 729