emooki
HomePrice mapTransactions
🇬🇧 English🇫🇷 Français🇩🇪 Deutsch🇪🇸 Español🇮🇹 Italiano

Real estate price map


Real estate price map in the municipality of Lullin, choose a section to see transactions by parcel.

Haute-Savoie (74)

Lullin - Real estate price m²

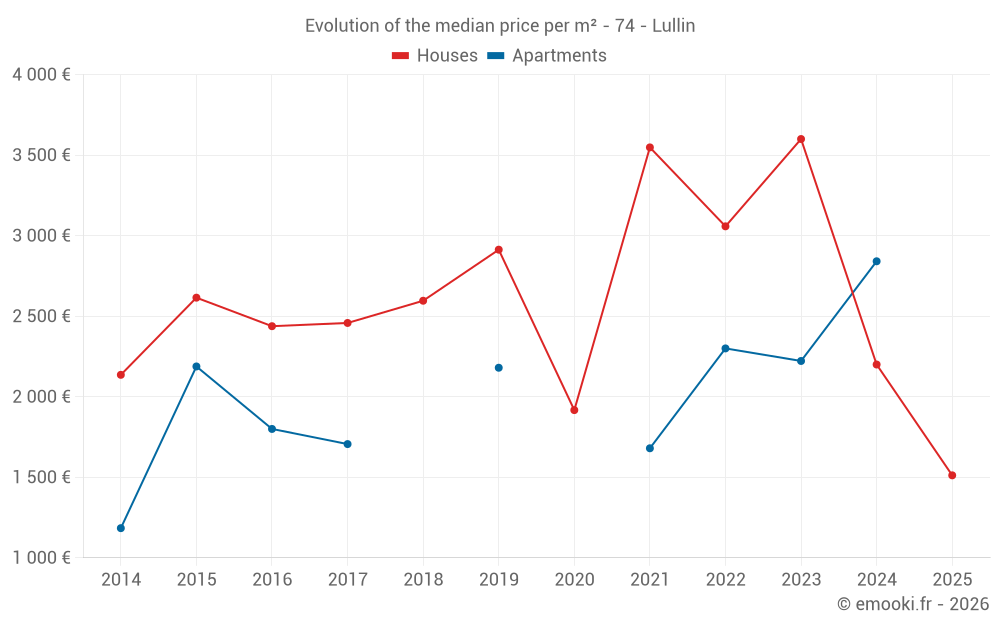
Median price of real estate
in the municipality of Lullin

HousesHouses
2 958  /m²
1-23-45-67-89-10
Reliability 7/10
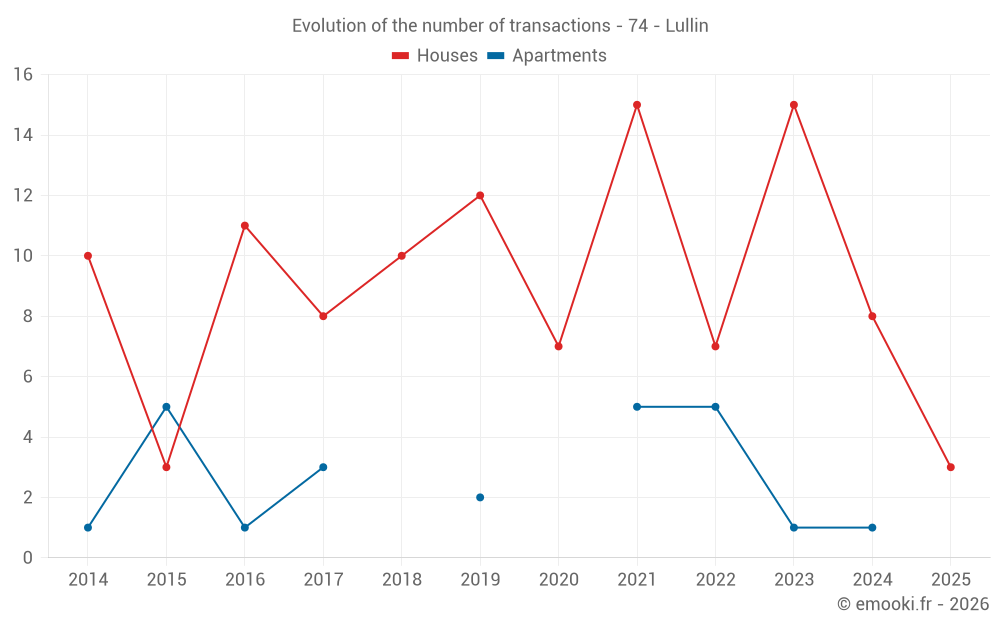
Median price on the 22 transactions of the last 24 months.
from 1 486 to
3 965  /m²
60% of transactions from the 2nd to the 8th deciles.
ApartmentsApartments
2 261  /m²
1-23-45-67-89-10
Reliability 5/10
Median price on the 10 transactions of the last 48 months.
DwellingsDwellings
2 852  /m²
1-23-45-67-89-10
Reliability 7/10
Median price on the 23 transactions of the last 24 months.
from 1 493 to
3 919  /m²
60% of transactions from the 2nd to the 8th deciles.

Yearly evolution

Evolution of the median price per m²

Evolution of the median price per m² - 74 - Lullin

Evolution of the number of transactions

Warning, last year incomplete. Projections made based on the proportions between semesters of the previous year at the departmental/national level and by type of property.

Evolution of the number of transactions - 74 - Lullin

Yearly data

Descending order
Year
Houses
house
transactions
Houses
house
Price per m²
Apartments
apt.
transactions
Apartments
apt.
Price per m²
2025
3
1 512 
0
--- 
2024
8
2 200 
1
2 841 
2023
15
3 600 
1
2 222 
2022
7
3 058 
5
2 300 
2021
15
3 548 
5
1 680 
2020
7
1 917 
0
--- 
2019
12
2 913 
2
2 180 
2018
10
2 596 
0
--- 
2017
8
2 458 
3
1 706 
2016
11
2 438 
1
1 800 
2015
3
2 615 
5
2 188 
2014
10
2 136 
1
1 184 

Analysis

Structure of prices per m²

Values of price percentiles per m² over the periods used for the estimated price of each type of property.

Structure of transaction amounts

Values of transaction amounts percentiles over the periods used for the estimated price of each type of property.

Transaction amounts and prices per m² by percentile

Ascending order
Percentile
Houses
house
Price per m²
Houses
house
Transaction amount
Apartments
apt.
Price per m²
Apartments
apt.
Transaction amount
10th percentile
973 
91 000 
1 505 
97 800 
20th percentile
1 486 
152 K
1 813 
116 K
30th percentile
1 699 
235 K
2 114 
127 K
40th percentile
2 685 
270 K
2 220 
135 K
50th percentile
2 958 
293 K
2 261 
146 K
60th percentile
3 400 
308 K
2 456 
162 K
70th percentile
3 616 
344 K
2 735 
176 K
80th percentile
3 965 
402 K
2 910 
215 K
90th percentile
4 665 
488 K
3 252 
367 K

National and departmental comparison

Evolution of the median price per m² of houses

Evolution of the median price per m² of apartments

Quarterly evolution

Evolution of the median price per m²

Evolution of the number of transactions

Quarterly data

Descending order
Quarter
Houses
house
transactions
Houses
house
Price per m²
Apartments
apt.
transactions
Apartments
apt.
Price per m²
2025 Q2
1
918 
0
--- 
2025 Q1
2
2 288 
0
--- 
2024 Q4
1
5 125 
1
2 841 
2024 Q3
1
4 697 
0
--- 
2024 Q2
2
1 124 
0
--- 
2024 Q1
4
2 200 
0
--- 
2023 Q4
3
3 782 
0
--- 
2023 Q3
8
3 597 
0
--- 
2023 Q2
3
3 414 
0
--- 
2023 Q1
1
5 985 
1
2 222 
2022 Q4
2
3 338 
0
--- 
2022 Q3
1
2 976 
2
2 282 
2022 Q2
3
4 189 
2
2 702 
2022 Q1
1
1 377 
1
2 300 
2021 Q4
5
4 375 
1
3 824 
2021 Q3
3
3 893 
2
1 272 
2021 Q2
5
1 324 
2
1 811 
2021 Q1
2
2 416 
0
--- 
2020 Q4
2
2 490 
0
--- 
2020 Q3
5
1 706 
0
--- 
2019 Q4
2
3 670 
1
2 253 
2019 Q3
3
3 408 
0
--- 
2019 Q2
4
2 344 
1
2 108 
2019 Q1
3
2 817 
0
--- 
2018 Q4
2
2 976 
0
--- 
2018 Q3
4
2 596 
0
--- 
2018 Q2
2
3 302 
0
--- 
2018 Q1
2
2 116 
0
--- 
2017 Q4
1
2 043 
1
1 706 
2017 Q3
1
3 048 
1
2 276 
2017 Q2
1
2 180 
1
1 667 
2017 Q1
5
2 737 
0
--- 
2016 Q4
2
2 096 
0
--- 
2016 Q3
1
1 500 
1
1 800 
2016 Q2
5
2 857 
0
--- 
2016 Q1
3
2 366 
0
--- 
2015 Q4
2
2 436 
1
1 882 
2015 Q3
0
--- 
1
2 321 
2015 Q2
0
--- 
3
2 188 
2015 Q1
1
2 642 
0
--- 
2014 Q4
4
1 961 
1
1 184 
2014 Q3
2
2 464 
0
--- 
2014 Q2
4
2 584 
0
--- 

Overview of the latest real estate transactions

The following list is an anonymized overview of the latest transactions. For more details and to find all transactions, please use the map to view transactions by plot or the transaction search page for a search by criteria.

2025-04-30
7 769 
Sale
Land
970 m2
-Terres
Land
988 m2
-Terres
Land
1320 m2
-Terres
Land
1120 m2
-Terres
Land
576 m2
-Prés
Land
205 m2
-Terres
2025-04-23
90 000 
918  /m²(98 m²)
Sale
Houses
House
5 rooms
98 m2
Land
150 m2
-Sols
Land
192 m2
-Jardins
2025-03-28
56 678 
Sale
Land
1585 m2
-Landes
Land
1749 m2
-Terres
2025-03-21
490 000 
3 063  /m²(160 m²)
Sale
Houses
House
5 rooms
160 m2
1 outbuilding
Land
169 m2
-Sols
Land
1113 m2
-Terres
Land
45 m2
-Sols
2025-02-07
65 000 
1 512  /m²(43 m²)
Sale
Houses
House
3 rooms
43 m2
Land
355 m2
-Sols
Land
200 m2
-Jardins
Land
62 m2
-Terres
Land
60 m2
-Sols
2025-01-31
1 000 
Sale
Land
495 m2
-Prés
2025-01-13
20 
Sale
Land
5 m2
-Prés
Land
15 m2
-Prés
2024-12-20
179 000 
2 841  /m²(63 m²)
Sale
Apartments
Apartment
1 room
63 m2
2024-11-18
410 000 
5 125  /m²(80 m²)
Sale
Houses
House
4 rooms
80 m2
Land
339 m2
-Sols
Land
464 m2
-Sols
Land
270 m2
-Sols
2024-10-22
1 
Sale
Land
42 m2
-Terres
2024-10-22
3 327 
Sale
Land
1109 m2
-Terres
2024-09-30
465 000 
4 697  /m²(99 m²)
Sale
Houses
House
4 rooms
99 m2
Land
1433 m2
-Sols
2024-09-16
20 000 
Sale
Land
1535 m2
-Terres
2024-09-16
31 500 
Sale
1 outbuilding
Land
3261 m2
-Prés
Land
2277 m2
-Prés
Land
4173 m2
-Prés
Land
2395 m2
-Prés
Land
1492 m2
-Prés
Land
1896 m2
-Prés
Land
1887 m2
-Prés
Land
535 m2
-Prés
Land
1354 m2
-Prés
Land
694 m2
-Prés
2024-09-16
45 500 
Sale
Land
145 m2
-Sols
2024-09-06
6 000 
Sale
Land
6559 m2
-Futaies résineuses
Land
3192 m2
-Landes
2024-08-27
2 000 
Sale
Land
27 m2
-Sols
2024-07-12
40 000 
Sale
1 outbuilding
Land
41 m2
-Sols
Land
500 m2
-Prés
Land
453 m2
-Prés
Land
3070 m2
-Terres
Land
2920 m2
-Prés
Land
411 m2
-Prés
Land
60 m2
-Landes
2024-07-08
2 100 
Sale
Land
10 m2
-Terrains à bâtir
2024-06-26
500 
Sale
Land
808 m2
-Futaies résineuses
Land
1075 m2
-Futaies résineuses
330 transactions listed in the municipality

Haute-Savoie (74)

Most expensive cities

City
name
Descending orderHouses
house
Price per m²
15 679 
13 070 
12 664 
12 078 
11 412 
11 019 
10 026 
9 621 
City
name
Descending orderApartments
apt.
Price per m²
9 603 
8 676 
8 394 
7 898 
7 778 
6 792 
6 625 
6 373 

Least expensive cities

City
name
Ascending orderHouses
house
Price per m²
2 070 
2 093 
2 300 
2 436 
2 611 
2 622 
2 709 
2 733 
City
name
Ascending orderApartments
apt.
Price per m²
725 
1 145 
1 250 
1 405 
1 448 
1 548 
1 628 
1 632 
1 674 
1 729