Real estate price map
Real estate price map in the municipality of Annecy, choose a section to see transactions by parcel.
Price per m² in Annecy
Median price of real estate
in the municipality of Annecy
9 273 € /m²
6 494 € /m²
6 702 € /m²
36655 transactions listed in the municipality
Yearly data
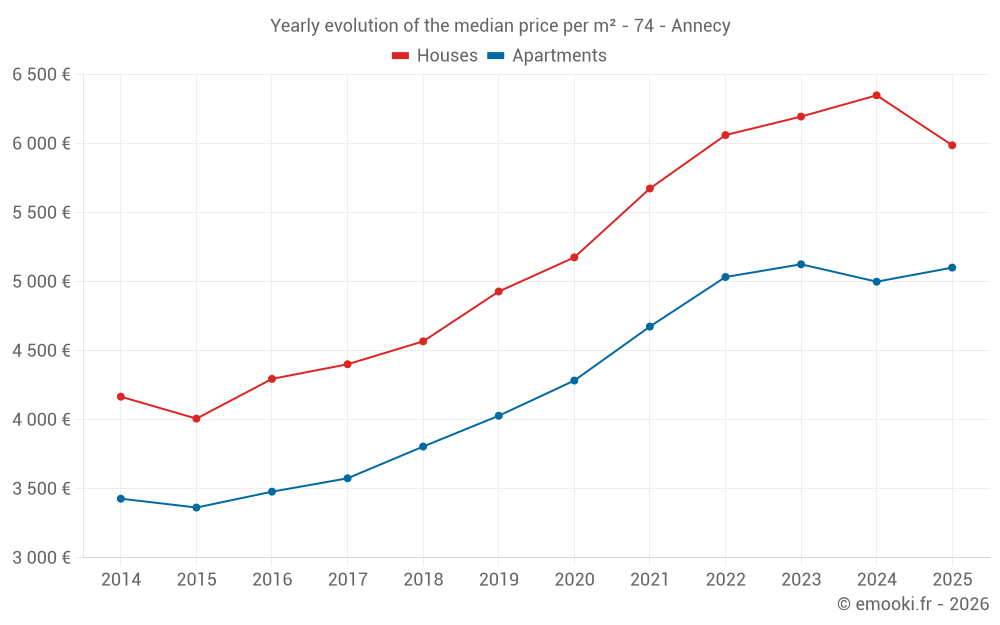
Yearly evolution of the median price per m²
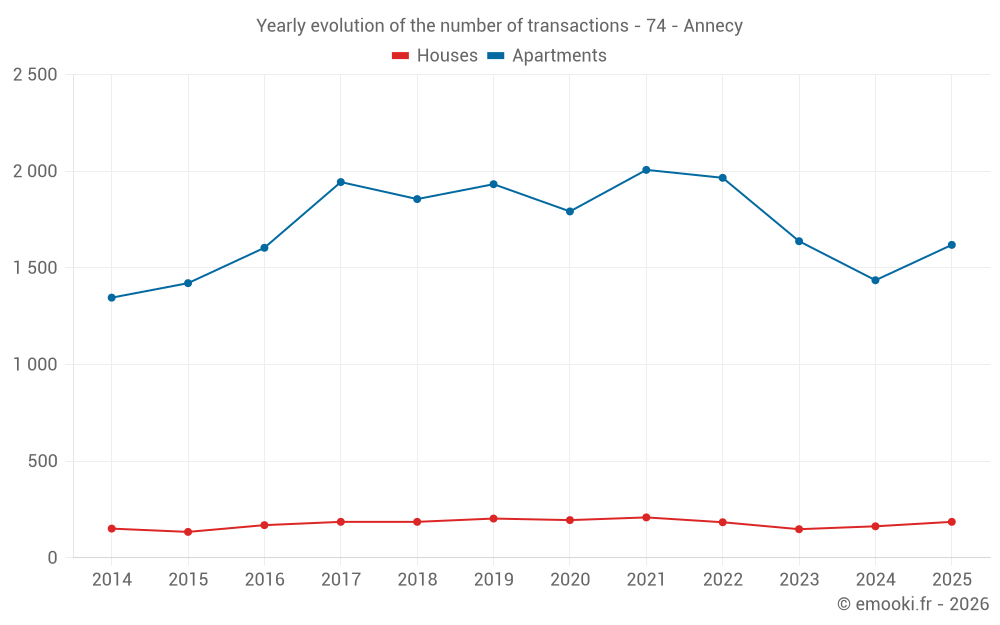
Yearly evolution of the number of transactions
Yearly table
transactions
Price per m²
transactions
Price per m²
Analysis
Structure of prices per m²
Values of price percentiles per m² over the periods used for the estimated price of each type of property.
Structure of transaction amounts
Values of transaction amounts percentiles over the periods used for the estimated price of each type of property.
Transaction amounts and prices per m² by percentile
Price per m²
Transaction amount
Price per m²
Transaction amount
National and departmental comparison
Evolution of the median price per m² of houses
Evolution of the median price per m² of apartments
Quarterly data
Quarterly evolution of the median price per m²
Quarterly evolution of the number of transactions
Quarterly table
transactions
Price per m²
transactions
Price per m²
Key takeaways
What is the price per m2 of houses in Annecy?
The median price on the 44 house transactions of the last 3 months in the municipality of Annecy was 6 323 € per square meter for a median property value of 699 675 €. Over this period, 60% of transactions were between 4 637 and 9 273 € per square meter (from the 2nd to the 8th deciles).
What is the price per m2 of apartments in Annecy?
The median price on the 352 apartment transactions of the last 3 months in the municipality of Annecy was 5 123 € per square meter for a median property value of 286 200 €. Over this period, 60% of transactions were between 4 003 and 6 494 € per square meter (from the 2nd to the 8th deciles).
Compare with neighboring municipalities
name
Price per m²
Price per m²
City information
Zip codes
- 74000 ANNECY
- FERRIERES 74370 ANNECY
- PRINGY 74370 ANNECY
- BALMONT 74600 ANNECY
- SEYNOD 74600 ANNECY
- VIEUGY 74600 ANNECY
- ANNECY LE VIEUX 74940 ANNECY
- CRAN GEVRIER 74960 ANNECY
- MEYTHET 74960 ANNECY