emooki
HomePrice mapTransactions
🇬🇧 English🇫🇷 Français🇩🇪 Deutsch🇪🇸 Español🇮🇹 Italiano

Real estate price map


Real estate price map in the municipality of Saint-Étienne-de-Cuines.

Savoie (73)
Saint-Étienne-de-Cuines

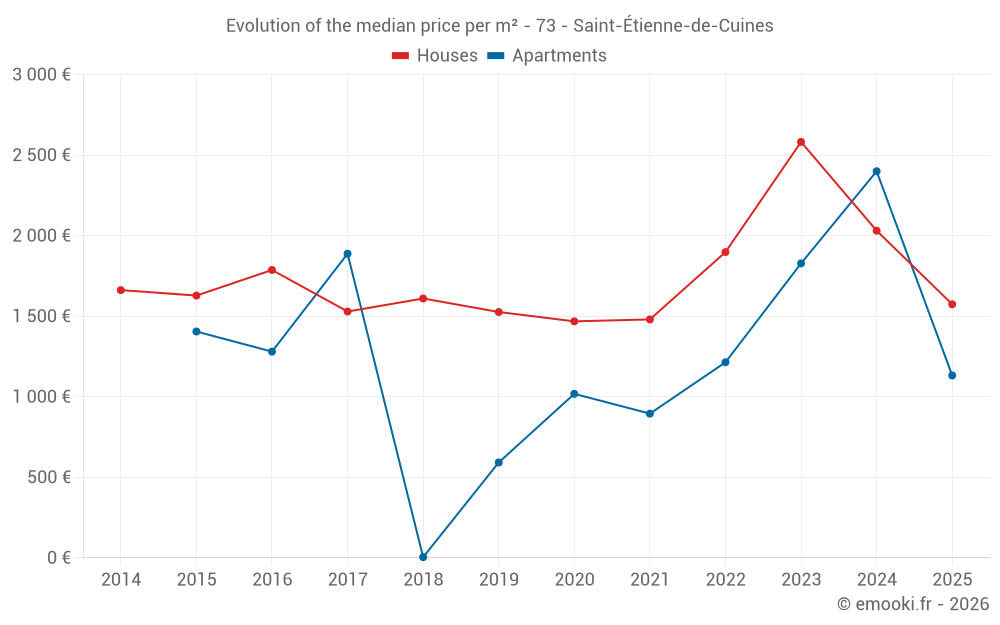
Median price of real estate
in the municipality of Saint-Étienne-de-Cuines

HousesHouses
2 168  /m²
1-23-45-67-89-10
Reliability 7/10
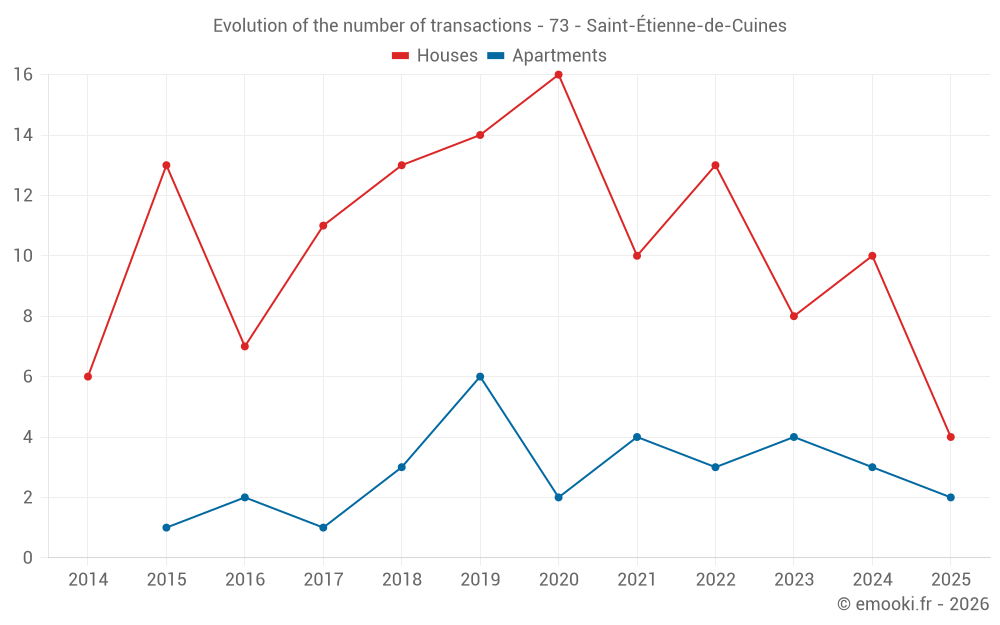
Median price on the 18 transactions of the last 24 months.
from 1 738 to
2 720  /m²
60% of transactions from the 2nd to the 8th deciles.
ApartmentsApartments
1 490  /m²
1-23-45-67-89-10
Reliability 5/10
Median price on the 13 transactions of the last 48 months.
from 983 to
2 057  /m²
60% of transactions from the 2nd to the 8th deciles.
DwellingsDwellings
2 065  /m²
1-23-45-67-89-10
Reliability 7/10
Median price on the 25 transactions of the last 24 months.
from 1 586 to
2 612  /m²
60% of transactions from the 2nd to the 8th deciles.
HousesEvolution of the price per m² of houses since...
1 year
--
2 years
--
3 years
--
4 years
--
5 years
--
6 years
--
7 years
--
8 years
--
9 years
--
10 years
--
11 years
--
ApartmentsEvolution of the price per m² of apartments since...
1 year
--
2 years
--
3 years
--
4 years
--
5 years
--
6 years
--
7 years
--
8 years
--
9 years
--
10 years
--
11 years
--

Yearly evolution

Evolution of the median price per m²

Evolution of the number of transactions

Warning, last year incomplete. Projections made based on the proportions between semesters of the previous year at the departmental/national level and by type of property.

Yearly data

Descending order
Year
Houses
house
transactions
Houses
house
Price per m²
Apartments
apt.
transactions
Apartments
apt.
Price per m²
2025
4
1 574 
2
1 132 
2024
10
2 031 
3
2 400 
2023
8
2 582 
4
1 828 
2022
13
1 898 
3
1 214 
2021
10
1 480 
4
895 
2020
16
1 468 
2
1 018 
2019
14
1 526 
6
592 
2018
13
1 610 
3
4 
2017
11
1 529 
1
1 888 
2016
7
1 787 
2
1 280 
2015
13
1 628 
1
1 405 
2014
6
1 662 
0
--- 

Analysis

Structure of prices per m²

Values of price percentiles per m² over the periods used for the estimated price of each type of property.

Structure of transaction amounts

Values of transaction amounts percentiles over the periods used for the estimated price of each type of property.

Transaction amounts and prices per m² by percentile

Ascending order
Percentile
Houses
house
Price per m²
Houses
house
Transaction amount
Apartments
apt.
Price per m²
Apartments
apt.
Transaction amount
10th percentile
1 170 
78 800 
870 
53 200 
20th percentile
1 738 
96 480 
983 
70 800 
30th percentile
1 978 
124 K
1 128 
88 380 
40th percentile
1 993 
165 K
1 377 
106 K
50th percentile
2 168 
180 K
1 490 
125 K
60th percentile
2 348 
211 K
1 772 
148 K
70th percentile
2 580 
233 K
1 936 
156 K
80th percentile
2 720 
252 K
2 057 
178 K
90th percentile
2 871 
275 K
2 344 
198 K

National and departmental comparison

Evolution of the median price per m² of houses

Evolution of the median price per m² of apartments

Quarterly evolution

Evolution of the median price per m²

Evolution of the number of transactions

Quarterly data

Descending order
Quarter
Houses
house
transactions
Houses
house
Price per m²
Apartments
apt.
transactions
Apartments
apt.
Price per m²
2025 Q2
0
--- 
1
1 418 
2025 Q1
4
1 574 
1
845 
2024 Q4
3
2 421 
0
--- 
2024 Q3
4
2 134 
1
2 400 
2024 Q2
3
1 978 
1
2 121 
2024 Q1
0
--- 
1
2 438 
2023 Q4
3
2 754 
1
1 920 
2023 Q3
1
3 049 
1
1 735 
2023 Q2
4
1 838 
0
--- 
2023 Q1
0
--- 
2
1 480 
2022 Q4
5
1 898 
0
--- 
2022 Q3
1
2 400 
0
--- 
2022 Q2
5
1 917 
2
1 352 
2022 Q1
2
1 140 
1
971 
2021 Q4
3
2 371 
1
828 
2021 Q3
2
1 046 
0
--- 
2021 Q2
3
1 951 
2
1 209 
2021 Q1
2
1 256 
1
962 
2020 Q4
5
1 503 
1
550 
2020 Q3
2
1 417 
0
--- 
2020 Q2
5
1 633 
1
1 485 
2020 Q1
4
1 114 
0
--- 
2019 Q4
6
1 928 
1
691 
2019 Q3
2
1 368 
1
494 
2019 Q2
3
1 483 
3
740 
2019 Q1
3
1 172 
1
324 
2018 Q4
4
1 254 
0
--- 
2018 Q3
3
1 541 
0
--- 
2018 Q2
3
2 093 
3
4 
2018 Q1
3
1 263 
0
--- 
2017 Q4
1
1 744 
0
--- 
2017 Q3
2
1 264 
0
--- 
2017 Q2
4
1 466 
0
--- 
2017 Q1
4
1 684 
1
1 888 
2016 Q4
2
2 047 
0
--- 
2016 Q3
0
--- 
1
1 280 
2016 Q2
2
1 672 
0
--- 
2016 Q1
3
1 787 
1
1 281 
2015 Q4
4
1 074 
0
--- 
2015 Q3
4
1 524 
1
1 405 
2015 Q2
2
984 
0
--- 
2015 Q1
3
2 350 
0
--- 
2014 Q4
2
1 532 
0
--- 
2014 Q3
2
1 321 
0
--- 
2014 Q1
2
1 771 
0
--- 

Savoie (73)

Most expensive cities

City
name
Descending orderHouses
house
Price per m²
41 730 
15 064 
9 926 
8 106 
7 708 
7 667 
7 570 
6 752 
6 184 
City
name
Descending orderApartments
apt.
Price per m²
12 707 
12 414 
10 959 
10 302 
8 611 
6 667 
6 146 
6 116 
5 770 

Least expensive cities

City
name
Ascending orderHouses
house
Price per m²
1 250 
1 316 
1 333 
1 344 
1 354 
1 384 
1 500 
City
name
Ascending orderApartments
apt.
Price per m²
400 
520 
528 
672 
797