Real estate price map
Real estate price map in the municipality of Épierre, choose a section to see transactions by parcel.
Savoie (73)
Price per m² in Épierre
Median price of real estate
in the municipality of Épierre
Houses
1 864 € /m²
Reliability 6/10
Median price on the 26 transactions of the last 36 months.
from 1 123 to
2 857 € /m²
2 857 € /m²
60% of transactions from the 2nd to the 8th deciles.
Apartments
1 120 € /m²
Reliability 3/10
Median price on the 8 transactions of the last 72 months.
Dwellings
1 713 € /m²
Reliability 7/10
Median price on the 15 transactions of the last 24 months.
from 1 199 to
2 645 € /m²
2 645 € /m²
60% of transactions from the 2nd to the 8th deciles.
Yearly evolution
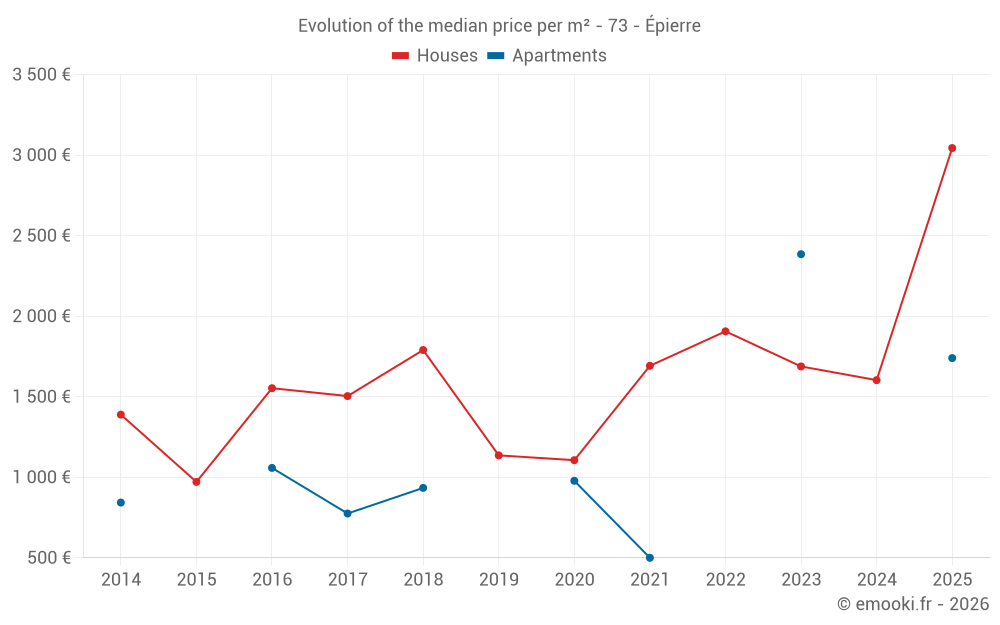
Evolution of the median price per m²
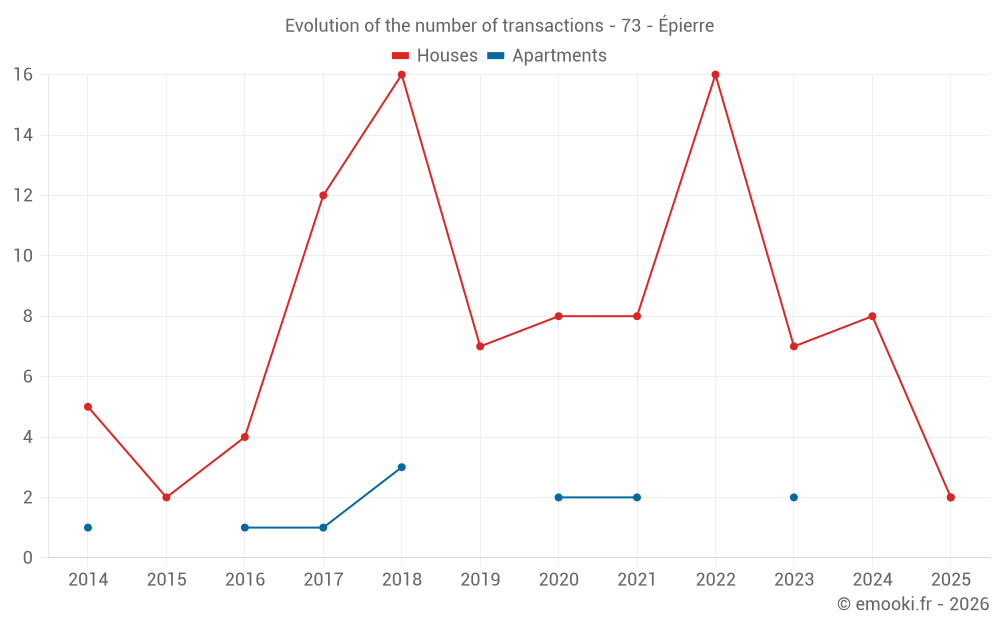
Evolution of the number of transactions
Warning, last year incomplete. Projections made based on the proportions between semesters of the previous year at the departmental/national level and by type of property.
Yearly data
Year
house
transactions
transactions
house
Price per m²
Price per m²
apt.
transactions
transactions
apt.
Price per m²
Price per m²
2025
2
3 044 €
2
1 740 €
2024
8
1 603 €
0
--- €
2023
7
1 688 €
2
2 385 €
2022
16
1 906 €
0
--- €
2021
8
1 692 €
2
500 €
2020
8
1 106 €
2
978 €
2019
7
1 136 €
0
--- €
2018
16
1 790 €
3
934 €
2017
12
1 504 €
1
775 €
2016
4
1 553 €
1
1 058 €
2015
2
971 €
0
--- €
2014
5
1 389 €
1
843 €
Analysis
Structure of prices per m²
Values of price percentiles per m² over the periods used for the estimated price of each type of property.
Structure of transaction amounts
Values of transaction amounts percentiles over the periods used for the estimated price of each type of property.
Transaction amounts and prices per m² by percentile
Percentile
house
Price per m²
Price per m²
house
Transaction amount
Transaction amount
apt.
Price per m²
Price per m²
apt.
Transaction amount
Transaction amount
10th percentile
940 €
87 500 €
544 €
114 K€
20th percentile
1 123 €
100 K€
753 €
137 K€
30th percentile
1 219 €
132 K€
968 €
145 K€
40th percentile
1 667 €
145 K€
985 €
145 K€
50th percentile
1 864 €
155 K€
1 120 €
150 K€
60th percentile
2 188 €
168 K€
1 446 €
155 K€
70th percentile
2 536 €
189 K€
2 133 €
155 K€
80th percentile
2 857 €
220 K€
2 323 €
167 K€
90th percentile
3 149 €
253 K€
2 385 €
180 K€
National and departmental comparison
Evolution of the median price per m² of houses
Evolution of the median price per m² of apartments
Quarterly evolution
Evolution of the median price per m²
Evolution of the number of transactions
Quarterly data
Quarter
house
transactions
transactions
house
Price per m²
Price per m²
apt.
transactions
transactions
apt.
Price per m²
Price per m²
2025 Q2
1
2 800 €
2
1 740 €
2025 Q1
1
3 288 €
0
--- €
2024 Q3
1
1 713 €
0
--- €
2024 Q2
5
2 467 €
0
--- €
2024 Q1
2
1 308 €
0
--- €
2023 Q4
1
1 688 €
0
--- €
2023 Q3
1
1 109 €
1
2 385 €
2023 Q2
2
612 €
1
2 385 €
2023 Q1
3
2 188 €
0
--- €
2022 Q4
3
1 220 €
0
--- €
2022 Q3
6
2 174 €
0
--- €
2022 Q2
5
1 743 €
0
--- €
2022 Q1
2
1 820 €
0
--- €
2021 Q3
3
1 729 €
0
--- €
2021 Q2
3
1 250 €
1
611 €
2021 Q1
2
1 802 €
1
389 €
2020 Q4
2
1 276 €
0
--- €
2020 Q3
2
7 146 €
0
--- €
2020 Q2
2
774 €
0
--- €
2020 Q1
2
1 704 €
2
978 €
2019 Q4
2
1 444 €
0
--- €
2019 Q3
2
996 €
0
--- €
2019 Q2
1
1 864 €
0
--- €
2019 Q1
2
1 003 €
0
--- €
2018 Q4
5
1 762 €
0
--- €
2018 Q3
8
1 866 €
1
2 538 €
2018 Q2
2
1 694 €
1
934 €
2018 Q1
1
1 000 €
1
450 €
2017 Q4
1
1 822 €
0
--- €
2017 Q3
4
1 326 €
0
--- €
2017 Q2
7
1 467 €
0
--- €
2017 Q1
0
--- €
1
775 €
2016 Q4
2
1 454 €
0
--- €
2016 Q2
1
1 394 €
1
1 058 €
2016 Q1
1
1 712 €
0
--- €
2015 Q4
1
733 €
0
--- €
2015 Q3
1
1 209 €
0
--- €
2014 Q4
1
1 389 €
0
--- €
2014 Q3
2
1 806 €
0
--- €
2014 Q2
2
1 508 €
1
843 €
Overview of the latest real estate transactions
The following list is an anonymized overview of the latest transactions. For more details and to find all transactions, please use the map to view transactions by plot or the transaction search page for a search by criteria.
2025-06-27
175 000 €1 250 € /m²(140 m²)
Sale
Apartment
4 rooms
70 m2
Apartment
4 rooms
70 m2
4 outbuildings
Land
850 m2
-Sols
Land
262 m2
-Jardins
Land
255 m2
-Sols
2025-05-12
145 000 €2 231 € /m²(65 m²)
Sale
Apartment
3 rooms
65 m2
1 outbuilding
2025-04-23
55 000 €Sale
Land
200 m2
-Sols
Land
303 m2
-Jardins
2025-04-14
168 000 €2 800 € /m²(60 m²)
Sale
House
3 rooms
60 m2
Land
317 m2
-Sols
Land
250 m2
-Prés
Land
1011 m2
-Terres
2025-03-26
240 000 €3 288 € /m²(73 m²)
Sale
House
4 rooms
73 m2
1 outbuilding
Land
1046 m2
-Sols
2024-12-26
51 000 €Sale
Land
1245 m2
-Prés
Land
299 m2
-Jardins
2024-12-23
3 000 €Sale
Land
2260 m2
-Terres
Land
1130 m2
-Prés
Land
323 m2
-Jardins
2024-10-10
6 000 €Sale
Land
266 m2
-Terres
2024-09-11
225 000 €225 000 € /m²(1 m²)
Sale
Commercial property
1 m2
Land
338 m2
-Sols
1 outbuilding
Land
115 m2
-Jardins
Land
38 m2
-Sols
Land
84 m2
-Jardins
Land
366 m2
-Jardins
Land
192 m2
-Jardins
Land
675 m2
-Jardins
Land
308 m2
-Jardins
Land
447 m2
-Jardins
Land
1728 m2
-Terrains à bâtir
Land
419 m2
-Sols
2024-09-11
2 500 €Sale
Land
54 m2
-Terrains à bâtir
2024-07-25
152 500 €1 713 € /m²(89 m²)
Sale
House
2 rooms
89 m2
1 outbuilding
Land
491 m2
-Sols
Land
1420 m2
-Prés
Land
97 m2
-Prés
2024-06-12
800 €Sale
Land
1645 m2
-Taillis simples
Land
555 m2
-Taillis simples
Land
204 m2
-Prés
2024-06-12
185 000 €2 467 € /m²(75 m²)
Sale
House
4 rooms
75 m2
Land
93 m2
-Sols
Land
113 m2
-Sols
2024-06-11
50 000 €Sale
Land
200 m2
-Sols
Land
303 m2
-Jardins
2024-06-04
90 000 €692 € /m²(130 m²)
Sale
House
5 rooms
130 m2
Land
158 m2
-Sols
2024-05-31
271 638 €Sale
Land
1595 m2
-Prés
Land
4702 m2
-Prés
Land
2400 m2
-Taillis simples
2024-05-31
41 612 €Sale
Land
150 m2
-Prés
Land
1245 m2
-Prés
Land
299 m2
-Jardins
2024-05-24
1 070 €Sale
Land
1300 m2
-Taillis simples
Land
1917 m2
-Taillis simples
Land
20 m2
-Terres
Land
330 m2
-Terres
2024-05-07
185 000 €2 606 € /m²(71 m²)
Sale
House
6 rooms
71 m2
Land
820 m2
-Sols
2024-04-22
236 000 €3 147 € /m²(75 m²)
Sale
House
2 rooms
75 m2
Land
419 m2
-Sols
Land
329 m2
-Terrains à bâtir
186 transactions listed in the municipality
Compare with neighboring municipalities
City
name
name
house
Price per m²
Price per m²
apt.
Price per m²
Price per m²
City information
Zip code
- 73220 EPIERRE
Data source & update
- Latest publication of the property value request (DVF) database made available by the DGFiP on October 19, 2025, covering transactions up to 06/30/2025:
- Administrative/cadastral division as of September 1, 2025, and municipal movements as of January 1, 2025: