emooki
HomePrice mapTransactions
🇬🇧 English🇫🇷 Français🇩🇪 Deutsch🇪🇸 Español🇮🇹 Italiano

Real estate price map


Real estate price map in the municipality of Saint-Alban-d'Hurtières.

Savoie (73)
Saint-Alban-d'Hurtières

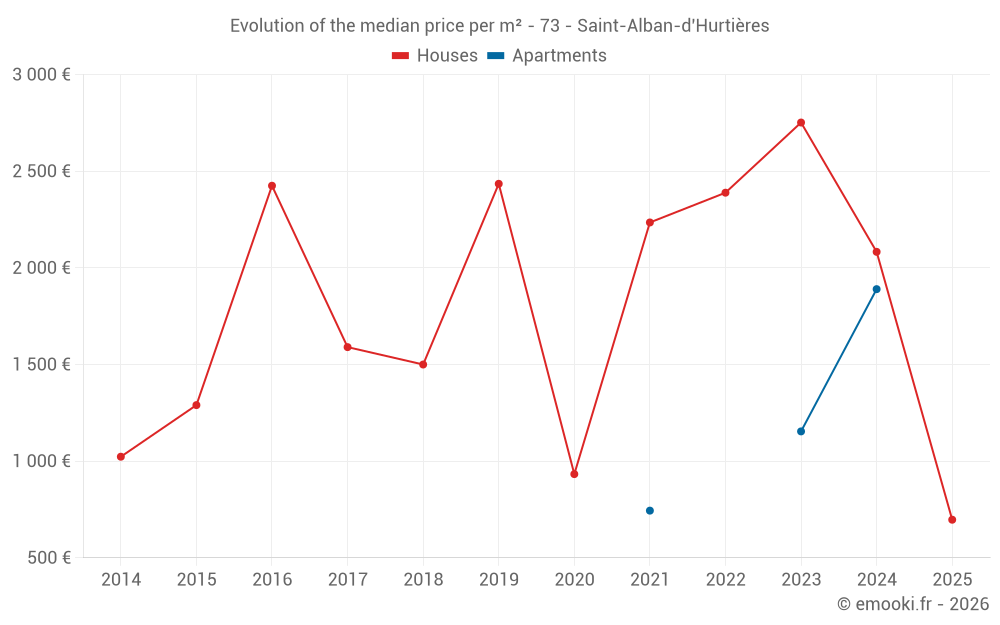
Median price of real estate
in the municipality of Saint-Alban-d'Hurtières

HousesHouses
2 049  /m²
1-23-45-67-89-10
Reliability 7/10
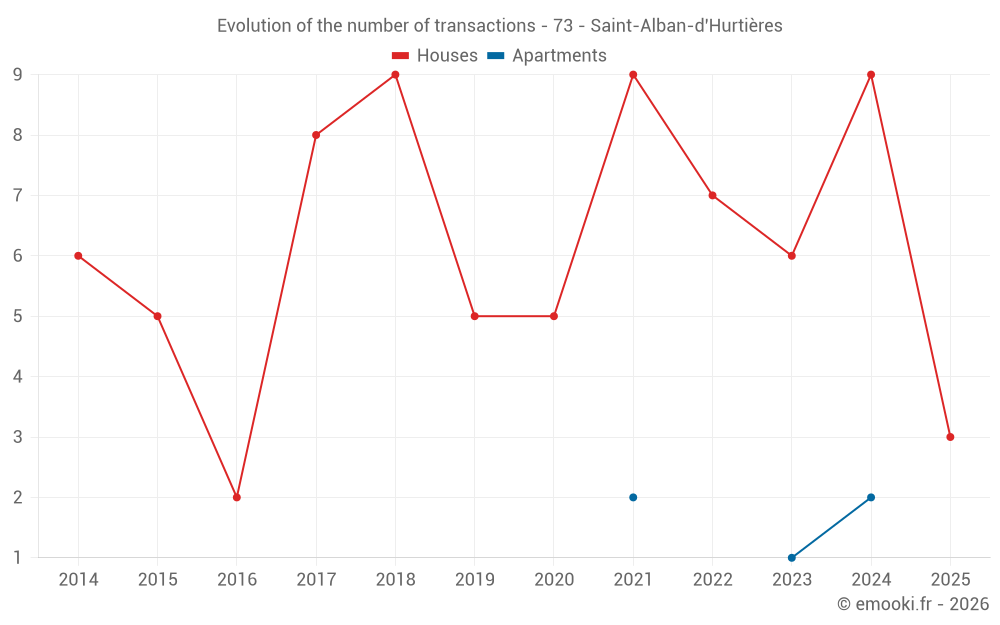
Median price on the 16 transactions of the last 24 months.
from 1 345 to
3 489  /m²
60% of transactions from the 2nd to the 8th deciles.
ApartmentsApartments
1 154  /m²
1-23-45-67-89-10
Reliability 2/10
Median price on the 5 transactions of the last 96 months.
DwellingsDwellings
1 993  /m²
1-23-45-67-89-10
Reliability 7/10
Median price on the 19 transactions of the last 24 months.
from 1 269 to
3 095  /m²
60% of transactions from the 2nd to the 8th deciles.
HousesEvolution of the price per m² of houses since...
1 year
--
2 years
--
3 years
--
4 years
--
5 years
--
6 years
--
7 years
--
8 years
--
9 years
--
10 years
--
11 years
--
ApartmentsEvolution of the price per m² of apartments since...
1 year
--
2 years
--
3 years
--
4 years
--
5 years
--
6 years
--
7 years
--
8 years
--
9 years
--
10 years
--
11 years
--

Yearly evolution

Evolution of the median price per m²

Evolution of the number of transactions

Warning, last year incomplete. Projections made based on the proportions between semesters of the previous year at the departmental/national level and by type of property.

Yearly data

Descending order
Year
Houses
house
transactions
Houses
house
Price per m²
Apartments
apt.
transactions
Apartments
apt.
Price per m²
2025
3
697 
0
--- 
2024
9
2 083 
2
1 890 
2023
6
2 752 
1
1 154 
2022
7
2 389 
0
--- 
2021
9
2 235 
2
744 
2020
5
933 
0
--- 
2019
5
2 435 
0
--- 
2018
9
1 500 
0
--- 
2017
8
1 590 
0
--- 
2016
2
2 425 
0
--- 
2015
5
1 290 
0
--- 
2014
6
1 023 
0
--- 

Analysis

Structure of prices per m²

Values of price percentiles per m² over the periods used for the estimated price of each type of property.

Structure of transaction amounts

Values of transaction amounts percentiles over the periods used for the estimated price of each type of property.

Transaction amounts and prices per m² by percentile

Ascending order
Percentile
Houses
house
Price per m²
Houses
house
Transaction amount
Apartments
apt.
Price per m²
Apartments
apt.
Transaction amount
10th percentile
586 
30 500 
697 
93 461 
20th percentile
1 345 
60 000 
884 
117 K
30th percentile
1 482 
98 375 
1 012 
129 K
40th percentile
1 975 
120 K
1 083 
129 K
50th percentile
2 049 
145 K
1 154 
130 K
60th percentile
2 529 
170 K
1 407 
135 K
70th percentile
2 722 
219 K
1 660 
141 K
80th percentile
3 489 
250 K
1 828 
151 K
90th percentile
3 648 
262 K
1 911 
165 K

National and departmental comparison

Evolution of the median price per m² of houses

Evolution of the median price per m² of apartments

Quarterly evolution

Evolution of the median price per m²

Evolution of the number of transactions

Quarterly data

Descending order
Quarter
Houses
house
transactions
Houses
house
Price per m²
Apartments
apt.
transactions
Apartments
apt.
Price per m²
2025 Q2
1
476 
0
--- 
2025 Q1
2
1 032 
0
--- 
2024 Q4
4
1 937 
0
--- 
2024 Q3
4
2 049 
2
1 890 
2024 Q2
1
2 833 
0
--- 
2023 Q3
4
3 648 
1
1 154 
2023 Q1
2
745 
0
--- 
2022 Q3
3
3 017 
0
--- 
2022 Q2
4
1 476 
0
--- 
2021 Q4
1
1 438 
1
511 
2021 Q3
3
2 612 
1
977 
2021 Q2
4
2 772 
0
--- 
2021 Q1
1
1 767 
0
--- 
2020 Q4
1
2 724 
0
--- 
2020 Q3
2
996 
0
--- 
2020 Q2
1
733 
0
--- 
2020 Q1
1
933 
0
--- 
2019 Q4
2
1 968 
0
--- 
2019 Q2
1
1 903 
0
--- 
2019 Q1
2
2 837 
0
--- 
2018 Q4
2
1 565 
0
--- 
2018 Q3
3
1 500 
0
--- 
2018 Q2
1
1 444 
0
--- 
2018 Q1
3
1 904 
0
--- 
2017 Q4
3
1 080 
0
--- 
2017 Q3
3
2 036 
0
--- 
2017 Q1
2
1 684 
0
--- 
2016 Q2
2
2 425 
0
--- 
2015 Q4
1
1 765 
0
--- 
2015 Q3
2
788 
0
--- 
2015 Q2
1
233 
0
--- 
2015 Q1
1
1 721 
0
--- 
2014 Q4
2
720 
0
--- 
2014 Q3
1
707 
0
--- 
2014 Q2
2
1 857 
0
--- 
2014 Q1
1
1 296 
0
--- 

Savoie (73)

Most expensive cities

City
name
Descending orderHouses
house
Price per m²
41 730 
15 064 
9 926 
8 106 
7 708 
7 667 
7 570 
6 752 
6 184 
City
name
Descending orderApartments
apt.
Price per m²
12 707 
12 414 
10 959 
10 302 
8 611 
6 667 
6 146 
6 116 
5 770 

Least expensive cities

City
name
Ascending orderHouses
house
Price per m²
1 250 
1 316 
1 333 
1 344 
1 354 
1 384 
1 500 
City
name
Ascending orderApartments
apt.
Price per m²
400 
520 
528 
672 
797