Real estate price map
Real estate price map in the municipality of Saint-Calais, choose a section to see transactions by parcel.
Sarthe (72)
Price per m² in Saint-Calais
Median price of real estate
in the municipality of Saint-Calais
Houses
973 € /m²
Reliability 9/10
Median price on the 23 transactions of the last 6 months.
from 539 to
1 302 € /m²
1 302 € /m²
60% of transactions from the 2nd to the 8th deciles.
Apartments
454 € /m²
Reliability 4/10
Median price on the 14 transactions of the last 60 months.
from 220 to
986 € /m²
986 € /m²
60% of transactions from the 2nd to the 8th deciles.
Dwellings
903 € /m²
Reliability 9/10
Median price on the 24 transactions of the last 6 months.
from 539 to
1 299 € /m²
1 299 € /m²
60% of transactions from the 2nd to the 8th deciles.
Evolution of the price per m² of houses since...
1 year
+23%
2 years
+3.3%
3 years
+4.6%
4 years
+17%
5 years
+26%
6 years
+2.6%
7 years
+36%
8 years
+47%
9 years
+18%
10 years
-7.5%
11 years
+5.9%
The price per m² of houses has increased by 47% since 8 years, but it has decreased by 7.5% in 10 years.
774 transactions listed in the municipality
Yearly data
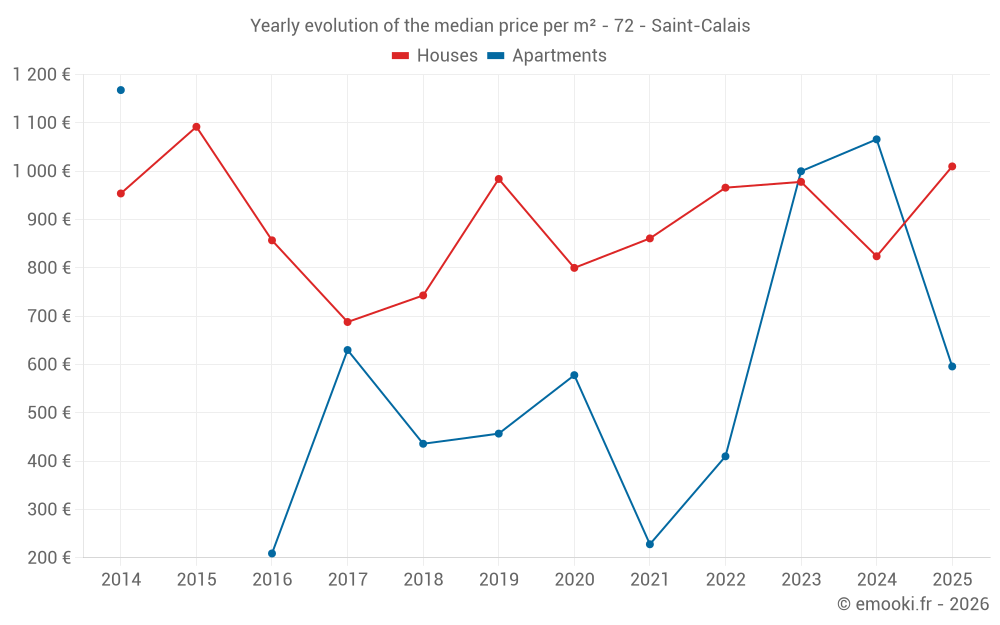
Yearly evolution of the median price per m²
Yearly evolution of the number of transactions

Yearly table
Year
house
transactions
transactions
house
Price per m²
Price per m²
apt.
transactions
transactions
apt.
Price per m²
Price per m²
2025
42
1 010 €
2
596 €
2024
47
824 €
2
1 066 €
2023
48
978 €
1
1 000 €
2022
62
966 €
4
410 €
2021
54
861 €
5
228 €
2020
37
800 €
4
578 €
2019
33
984 €
3
457 €
2018
31
743 €
3
436 €
2017
27
688 €
2
630 €
2016
33
857 €
3
209 €
2015
24
1 092 €
0
--- €
2014
22
954 €
2
1 168 €
Analysis
Structure of prices per m²
Values of price percentiles per m² over the periods used for the estimated price of each type of property.
Structure of transaction amounts
Values of transaction amounts percentiles over the periods used for the estimated price of each type of property.
Transaction amounts and prices per m² by percentile
Percentile
house
Price per m²
Price per m²
house
Transaction amount
Transaction amount
apt.
Price per m²
Price per m²
apt.
Transaction amount
Transaction amount
10th percentile
490 €
27 600 €
179 €
32 100 €
20th percentile
539 €
45 200 €
220 €
38 800 €
30th percentile
640 €
53 000 €
261 €
40 000 €
40th percentile
736 €
57 400 €
408 €
50 500 €
50th percentile
973 €
60 000 €
454 €
55 250 €
60th percentile
1 169 €
72 800 €
506 €
63 600 €
70th percentile
1 260 €
94 640 €
711 €
104 K€
80th percentile
1 302 €
113 K€
986 €
126 K€
90th percentile
1 431 €
139 K€
1 035 €
247 K€
National and departmental comparison
Evolution of the median price per m² of houses
Evolution of the median price per m² of apartments
Quarterly data
Quarterly evolution of the median price per m²
Quarterly evolution of the number of transactions
Quarterly table
Quarter
house
transactions
transactions
house
Price per m²
Price per m²
apt.
transactions
transactions
apt.
Price per m²
Price per m²
2025 Q4
8
564 €
0
--- €
2025 Q3
15
980 €
1
682 €
2025 Q2
8
877 €
0
--- €
2025 Q1
11
1 091 €
1
509 €
2024 Q4
13
750 €
0
--- €
2024 Q3
14
945 €
0
--- €
2024 Q2
10
806 €
1
1 083 €
2024 Q1
10
818 €
1
1 050 €
2023 Q4
11
1 183 €
0
--- €
2023 Q3
11
936 €
1
1 000 €
2023 Q2
14
1 148 €
0
--- €
2023 Q1
12
822 €
0
--- €
2022 Q4
16
994 €
1
412 €
2022 Q3
16
1 106 €
1
167 €
2022 Q2
18
898 €
0
--- €
2022 Q1
12
888 €
2
451 €
2021 Q4
14
775 €
1
135 €
2021 Q3
16
902 €
2
602 €
2021 Q2
15
1 000 €
1
208 €
2021 Q1
9
862 €
1
265 €
2020 Q4
10
816 €
0
--- €
2020 Q3
9
905 €
0
--- €
2020 Q2
5
615 €
2
578 €
2020 Q1
13
727 €
2
720 €
2019 Q4
10
1 084 €
1
457 €
2019 Q3
8
808 €
0
--- €
2019 Q2
9
600 €
1
329 €
2019 Q1
6
823 €
1
485 €
2018 Q4
4
279 €
0
--- €
2018 Q3
6
802 €
1
69 €
2018 Q2
14
793 €
1
488 €
2018 Q1
7
743 €
1
436 €
2017 Q4
6
1 149 €
0
--- €
2017 Q3
6
534 €
0
--- €
2017 Q2
10
730 €
1
477 €
2017 Q1
5
625 €
1
784 €
2016 Q4
6
872 €
2
266 €
2016 Q3
8
807 €
0
--- €
2016 Q2
12
1 047 €
1
209 €
2016 Q1
7
857 €
0
--- €
2015 Q4
8
1 139 €
0
--- €
2015 Q3
5
933 €
0
--- €
2015 Q2
3
1 043 €
0
--- €
2015 Q1
8
1 092 €
0
--- €
2014 Q4
5
563 €
0
--- €
2014 Q3
7
1 224 €
1
804 €
2014 Q2
5
1 025 €
1
1 531 €
2014 Q1
5
679 €
0
--- €
Key takeaways
What is the price per m2 of houses in Saint-Calais?
The median price on the 23 house transactions of the last 6 months in the municipality of Saint-Calais was 973 € per square meter for a median property value of 60 000 €. Over this period, 60% of transactions were between 539 and 1 302 € per square meter (from the 2nd to the 8th deciles).
Compare with neighboring municipalities
City
name
name
house
Price per m²
Price per m²
apt.
Price per m²
Price per m²
City information
Zip code
- 72120 ST CALAIS