emooki
HomePrice mapTransactions
🇬🇧 English🇫🇷 Français🇩🇪 Deutsch🇪🇸 Español🇮🇹 Italiano

Real estate price map


Real estate price map in the municipality of Précigné.

Sarthe (72)
Précigné

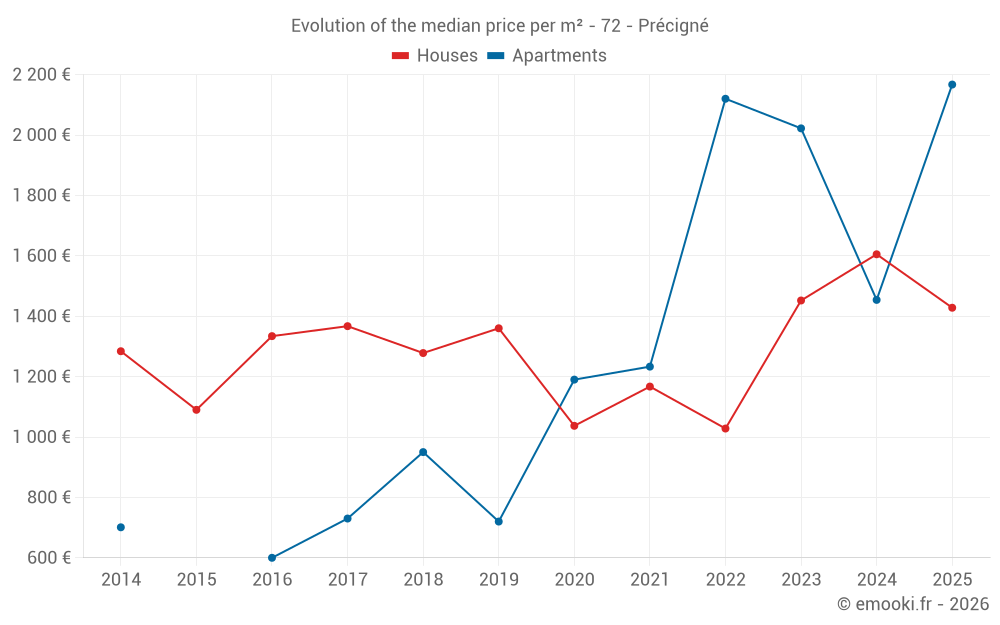
Median price of real estate
in the municipality of Précigné

HousesHouses
1 513  /m²
1-23-45-67-89-10
Reliability 8/10
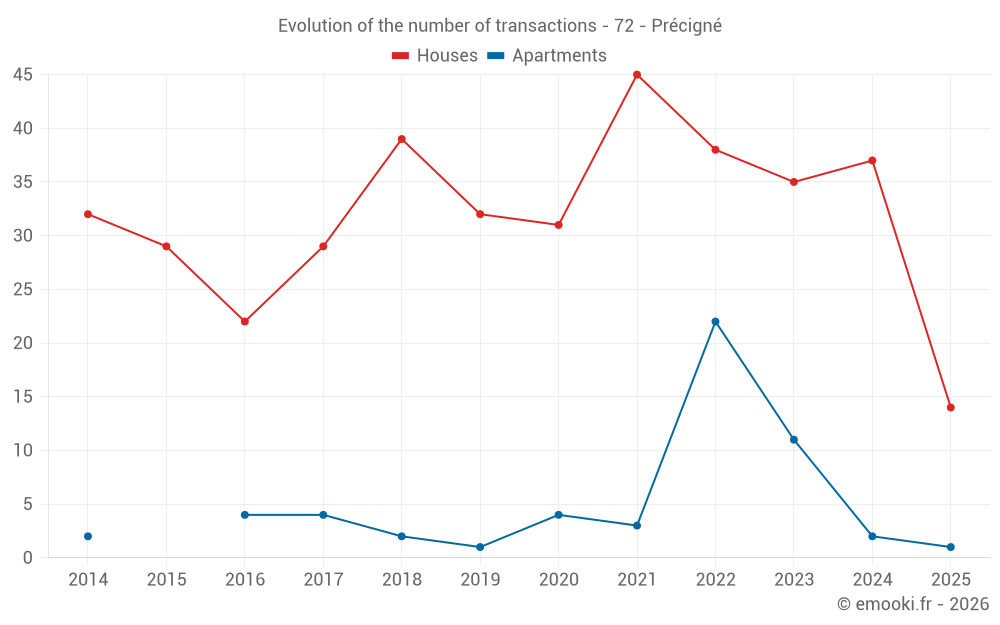
Median price on the 31 transactions of the last 12 months.
from 1 099 to
2 000  /m²
60% of transactions from the 2nd to the 8th deciles.
ApartmentsApartments
2 111  /m²
1-23-45-67-89-10
Reliability 6/10
Median price on the 25 transactions of the last 36 months.
from 1 331 to
2 168  /m²
60% of transactions from the 2nd to the 8th deciles.
DwellingsDwellings
1 573  /m²
1-23-45-67-89-10
Reliability 8/10
Median price on the 33 transactions of the last 12 months.
from 1 121 to
2 023  /m²
60% of transactions from the 2nd to the 8th deciles.
HousesEvolution of the price per m² of houses since...
1 year
-11%
2 years
-1.7%
3 years
+39%
4 years
+22%
5 years
+38%
6 years
+5%
7 years
+12%
8 years
+4.5%
9 years
+7%
10 years
+31%
11 years
+11%
ApartmentsEvolution of the price per m² of apartments since...
1 year
--
2 years
--
3 years
--
4 years
--
5 years
--
6 years
--
7 years
--
8 years
--
9 years
--
10 years
--
11 years
--

Yearly evolution

Evolution of the median price per m²

Evolution of the number of transactions

Warning, last year incomplete. Projections made based on the proportions between semesters of the previous year at the departmental/national level and by type of property.

Yearly data

Descending order
Year
Houses
house
transactions
Houses
house
Price per m²
Apartments
apt.
transactions
Apartments
apt.
Price per m²
2025
14
1 428 
1
2 167 
2024
37
1 605 
2
1 454 
2023
35
1 452 
11
2 022 
2022
38
1 028 
22
2 120 
2021
45
1 167 
3
1 233 
2020
31
1 037 
4
1 190 
2019
32
1 360 
1
720 
2018
39
1 278 
2
950 
2017
29
1 367 
4
730 
2016
22
1 334 
4
600 
2015
29
1 090 
0
--- 
2014
32
1 284 
2
701 

Analysis

Structure of prices per m²

Values of price percentiles per m² over the periods used for the estimated price of each type of property.

Structure of transaction amounts

Values of transaction amounts percentiles over the periods used for the estimated price of each type of property.

Transaction amounts and prices per m² by percentile

Ascending order
Percentile
Houses
house
Price per m²
Houses
house
Transaction amount
Apartments
apt.
Price per m²
Apartments
apt.
Transaction amount
10th percentile
1 012 
100 K
1 042 
54 240 
20th percentile
1 099 
145 K
1 331 
64 920 
30th percentile
1 254 
160 K
1 773 
65 000 
40th percentile
1 450 
160 K
2 000 
65 123 
50th percentile
1 513 
166 K
2 111 
68 000 
60th percentile
1 608 
172 K
2 159 
75 280 
70th percentile
1 703 
192 K
2 167 
83 320 
80th percentile
2 000 
210 K
2 168 
90 200 
90th percentile
2 182 
232 K
2 187 
97 010 

National and departmental comparison

Evolution of the median price per m² of houses

Evolution of the median price per m² of apartments

Quarterly evolution

Evolution of the median price per m²

Evolution of the number of transactions

Quarterly data

Descending order
Quarter
Houses
house
transactions
Houses
house
Price per m²
Apartments
apt.
transactions
Apartments
apt.
Price per m²
2025 Q2
5
1 099 
0
--- 
2025 Q1
9
1 513 
1
2 167 
2024 Q4
8
1 780 
0
--- 
2024 Q3
9
1 584 
1
1 870 
2024 Q2
10
1 650 
0
--- 
2024 Q1
10
1 436 
1
1 039 
2023 Q4
8
1 875 
2
1 237 
2023 Q3
9
1 645 
1
870 
2023 Q2
8
940 
3
2 022 
2023 Q1
10
1 456 
5
2 111 
2022 Q4
5
873 
1
1 600 
2022 Q3
13
1 042 
10
2 160 
2022 Q2
10
1 584 
7
2 052 
2022 Q1
10
1 007 
4
2 066 
2021 Q4
7
1 345 
1
2 013 
2021 Q3
16
1 178 
0
--- 
2021 Q2
13
1 299 
0
--- 
2021 Q1
9
900 
2
1 228 
2020 Q4
14
1 141 
3
1 667 
2020 Q3
8
1 260 
0
--- 
2020 Q2
6
686 
1
533 
2020 Q1
3
713 
0
--- 
2019 Q4
8
1 180 
0
--- 
2019 Q3
5
1 226 
0
--- 
2019 Q2
11
1 462 
0
--- 
2019 Q1
8
1 545 
1
720 
2018 Q4
9
1 297 
0
--- 
2018 Q3
11
1 302 
1
1 199 
2018 Q2
8
1 494 
1
700 
2018 Q1
11
996 
0
--- 
2017 Q4
13
1 128 
1
720 
2017 Q3
6
1 608 
2
740 
2017 Q2
4
1 074 
1
130 
2017 Q1
6
1 342 
0
--- 
2016 Q4
4
1 164 
1
923 
2016 Q3
9
1 464 
1
601 
2016 Q2
5
1 263 
0
--- 
2016 Q1
4
1 006 
2
384 
2015 Q4
3
1 707 
0
--- 
2015 Q3
8
1 076 
0
--- 
2015 Q2
13
1 200 
0
--- 
2015 Q1
5
774 
0
--- 
2014 Q4
12
1 151 
0
--- 
2014 Q3
8
1 047 
1
700 
2014 Q2
4
1 823 
1
702 
2014 Q1
8
1 386 
0
--- 

Sarthe (72)

Most expensive cities

City
name
Descending orderHouses
house
Price per m²
2 340 
2 248 
2 190 
2 177 
2 167 
2 164 
City
name
Descending orderApartments
apt.
Price per m²
5 702 
2 111 
1 884 
1 726 
1 692 
1 651 

Least expensive cities

City
name
Ascending orderHouses
house
Price per m²
366 
538 
600 
612 
668 
City
name
Ascending orderApartments
apt.
Price per m²
172 
270 
313