emooki
HomePrice mapTransactions
🇬🇧 English🇫🇷 Français🇩🇪 Deutsch🇪🇸 Español🇮🇹 Italiano

Real estate price map


Real estate price map in the municipality of Saint-Georges-du-Bois, choose a section to see transactions by parcel.

Sarthe (72)

Saint-Georges-du-Bois - Real estate price m²

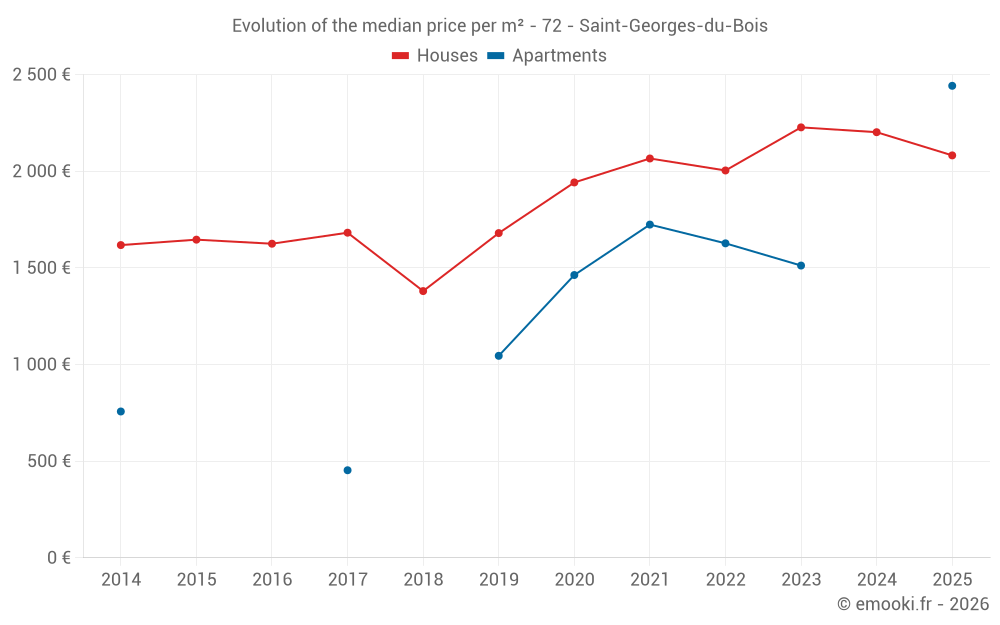
Median price of real estate
in the municipality of Saint-Georges-du-Bois

HousesHouses
2 227  /m²
1-23-45-67-89-10
Reliability 7/10
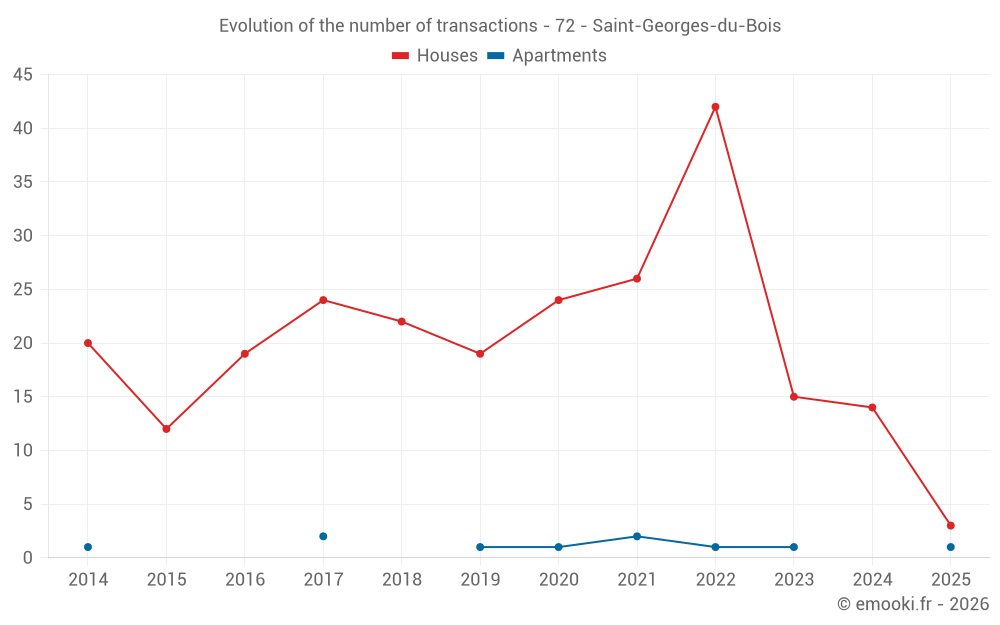
Median price on the 25 transactions of the last 24 months.
from 1 790 to
2 487  /m²
60% of transactions from the 2nd to the 8th deciles.
ApartmentsApartments
1 647  /m²
1-23-45-67-89-10
Reliability 3/10
Median price on the 6 transactions of the last 72 months.
DwellingsDwellings
2 227  /m²
1-23-45-67-89-10
Reliability 7/10
Median price on the 27 transactions of the last 24 months.
from 1 732 to
2 470  /m²
60% of transactions from the 2nd to the 8th deciles.

Yearly evolution

Evolution of the median price per m²

Evolution of the median price per m² - 72 - Saint-Georges-du-Bois

Evolution of the number of transactions

Warning, last year incomplete. Projections made based on the proportions between semesters of the previous year at the departmental/national level and by type of property.

Evolution of the number of transactions - 72 - Saint-Georges-du-Bois

Yearly data

Descending order
Year
Houses
house
transactions
Houses
house
Price per m²
Apartments
apt.
transactions
Apartments
apt.
Price per m²
2025
3
2 082 
1
2 442 
2024
14
2 202 
0
--- 
2023
15
2 227 
1
1 512 
2022
42
2 004 
1
1 627 
2021
26
2 066 
2
1 724 
2020
24
1 942 
1
1 463 
2019
19
1 680 
1
1 045 
2018
22
1 380 
0
--- 
2017
24
1 682 
2
453 
2016
19
1 625 
0
--- 
2015
12
1 646 
0
--- 
2014
20
1 618 
1
757 

Analysis

Structure of prices per m²

Values of price percentiles per m² over the periods used for the estimated price of each type of property.

Structure of transaction amounts

Values of transaction amounts percentiles over the periods used for the estimated price of each type of property.

Transaction amounts and prices per m² by percentile

Ascending order
Percentile
Houses
house
Price per m²
Houses
house
Transaction amount
Apartments
apt.
Price per m²
Apartments
apt.
Transaction amount
10th percentile
1 449 
123 K
1 488 
67 500 
20th percentile
1 790 
137 K
1 512 
70 000 
30th percentile
2 082 
150 K
1 570 
79 500 
40th percentile
2 191 
164 K
1 627 
89 000 
50th percentile
2 227 
199 K
1 647 
93 500 
60th percentile
2 254 
223 K
1 667 
98 000 
70th percentile
2 320 
232 K
1 724 
102 K
80th percentile
2 487 
262 K
1 780 
105 K
90th percentile
2 587 
327 K
2 111 
142 K

National and departmental comparison

Evolution of the median price per m² of houses

Evolution of the median price per m² of apartments

Quarterly evolution

Evolution of the median price per m²

Evolution of the number of transactions

Quarterly data

Descending order
Quarter
Houses
house
transactions
Houses
house
Price per m²
Apartments
apt.
transactions
Apartments
apt.
Price per m²
2025 Q2
2
1 628 
1
2 442 
2025 Q1
1
2 267 
0
--- 
2024 Q4
3
2 464 
0
--- 
2024 Q3
3
2 191 
0
--- 
2024 Q2
4
2 242 
0
--- 
2024 Q1
4
1 946 
0
--- 
2023 Q4
3
2 333 
1
1 512 
2023 Q3
5
2 549 
0
--- 
2023 Q2
4
1 772 
0
--- 
2023 Q1
3
2 188 
0
--- 
2022 Q4
7
1 341 
1
1 627 
2022 Q3
15
2 042 
0
--- 
2022 Q2
15
2 009 
0
--- 
2022 Q1
5
2 000 
0
--- 
2021 Q4
9
2 272 
0
--- 
2021 Q3
8
1 879 
2
1 724 
2021 Q2
5
2 143 
0
--- 
2021 Q1
4
2 036 
0
--- 
2020 Q4
6
1 874 
1
1 463 
2020 Q3
12
2 076 
0
--- 
2020 Q2
3
1 750 
0
--- 
2020 Q1
3
1 701 
0
--- 
2019 Q4
3
1 798 
0
--- 
2019 Q3
7
1 629 
0
--- 
2019 Q2
5
1 833 
1
1 045 
2019 Q1
4
1 408 
0
--- 
2018 Q4
6
1 378 
0
--- 
2018 Q3
5
1 263 
0
--- 
2018 Q2
8
1 590 
0
--- 
2018 Q1
3
1 105 
0
--- 
2017 Q4
8
1 682 
0
--- 
2017 Q3
4
1 653 
0
--- 
2017 Q2
5
1 846 
0
--- 
2017 Q1
7
1 633 
2
453 
2016 Q4
5
1 579 
0
--- 
2016 Q3
6
1 764 
0
--- 
2016 Q2
5
1 528 
0
--- 
2016 Q1
3
1 905 
0
--- 
2015 Q4
4
1 660 
0
--- 
2015 Q3
5
1 513 
0
--- 
2015 Q2
2
1 787 
0
--- 
2015 Q1
1
2 033 
0
--- 
2014 Q4
3
1 480 
0
--- 
2014 Q3
6
1 626 
0
--- 
2014 Q2
4
1 566 
0
--- 
2014 Q1
7
1 726 
1
757 

Overview of the latest real estate transactions

The following list is an anonymized overview of the latest transactions. For more details and to find all transactions, please use the map to view transactions by plot or the transaction search page for a search by criteria.

2025-06-24
105 000 
2 442  /m²(43 m²)
Sale
Apartments
Apartment
2 rooms
43 m2
2025-04-30
152 000 
2 082  /m²(73 m²)
Sale
Houses
House
4 rooms
73 m2
Land
572 m2
-Sols
2025-04-17
117 500 
1 175  /m²(100 m²)
Sale
Houses
House
3 rooms
100 m2
Land
416 m2
-Sols
2025-03-28
3 000 
Sale
Land
3625 m2
-Prés
2025-02-28
229 000 
2 267  /m²(101 m²)
Sale
Houses
House
5 rooms
101 m2
Land
1079 m2
-Sols
Land
921 m2
-Terrains d'agrément
Land
1089 m2
-Sols
Land
26328 m2
-Terres
/Légumière de plein champ
Land
1000 m2
-Sols
Land
2057 m2
-Terres
/Légumière de plein champ
Land
12 m2
-Sols
2024-12-30
43 000 
Sale
Land
3675 m2
-Terres
Land
258 m2
-Taillis simples
Land
2110 m2
-Vergers
/CIDRE
Land
3025 m2
-Terres
Land
110 m2
-Terrains d'agrément
Land
1635 m2
-Terrains d'agrément
Land
1350 m2
-Futaies résineuses
/Pins
Land
18851 m2
-Futaies résineuses
/Pins
Land
38709 m2
-Futaies résineuses
/Pins
Land
2825 m2
-Prés
Land
5678 m2
-Prés
Land
8450 m2
-Terres
Land
7282 m2
-Terres
Land
7398 m2
-Terres
Land
2155 m2
-Prés
Land
5266 m2
-Prés
2024-12-16
9 800 
Sale
Land
1503 m2
-Terrains d'agrément
2024-12-13
210 000 
2 471  /m²(85 m²)
Sale
Houses
House
5 rooms
85 m2
Land
633 m2
-Sols
2024-11-12
45 000 
978  /m²(46 m²)
Sale
Commercial property
46 m2
2024-11-05
257 000 
1 713  /m²(150 m²)
Sale
Houses
House
5 rooms
150 m2
Land
540 m2
-Sols
2024-10-28
170 000 
2 464  /m²(69 m²)
Sale
Houses
House
4 rooms
69 m2
Land
508 m2
-Sols
2024-09-19
135 000 
2 213  /m²(61 m²)
Sale
Houses
House
3 rooms
61 m2
Land
516 m2
-Sols
2024-08-14
195 000 
2 191  /m²(89 m²)
Sale
Houses
House
4 rooms
89 m2
Land
616 m2
-Sols
2024-08-01
65 000 
1 444  /m²(45 m²)
Sale
Houses
House
2 rooms
45 m2
Land
241 m2
-Sols
2024-07-02
68 000 
Sale
Land
167 m2
-Terrains à bâtir
Land
316 m2
-Terrains à bâtir
2024-06-26
155 000 
2 246  /m²(69 m²)
Sale
Houses
House
4 rooms
69 m2
Land
567 m2
-Sols
2024-06-06
219 000 
2 639  /m²(83 m²)
Sale
Houses
House
4 rooms
83 m2
Land
402 m2
-Sols
2024-06-05
15 000 
Sale
Land
795 m2
-Landes
Land
334 m2
-Landes
Land
308 m2
-Prés
Land
14 m2
-Prés
Land
16 m2
-Prés
Land
38 m2
-Prés
Land
359 m2
-Prés
Land
275 m2
-Prés
Land
507 m2
-Prés
Land
718 m2
-Landes
2024-05-17
798 
Sale
Land
133 m2
-Sols
2024-04-19
150 000 
1 456  /m²(103 m²)
Sale
Houses
House
5 rooms
103 m2
Land
1162 m2
-Terrains d'agrément
Land
1060 m2
-Sols
435 transactions listed in the municipality

Sarthe (72)

Most expensive cities

City
name
Descending orderHouses
house
Price per m²
2 340 
2 248 
2 190 
2 177 
2 167 
2 164 
City
name
Descending orderApartments
apt.
Price per m²
5 702 
2 111 
1 884 
1 726 
1 692 
1 651 

Least expensive cities

City
name
Ascending orderHouses
house
Price per m²
366 
538 
600 
612 
668 
City
name
Ascending orderApartments
apt.
Price per m²
172 
270 
313