emooki
HomePrice mapTransactions
🇬🇧 English🇫🇷 Français🇩🇪 Deutsch🇪🇸 Español🇮🇹 Italiano

Real estate price map


Real estate price map in the municipality of Sablé-sur-Sarthe, choose a section to see transactions by parcel.

Sarthe (72)
Sablé-sur-Sarthe

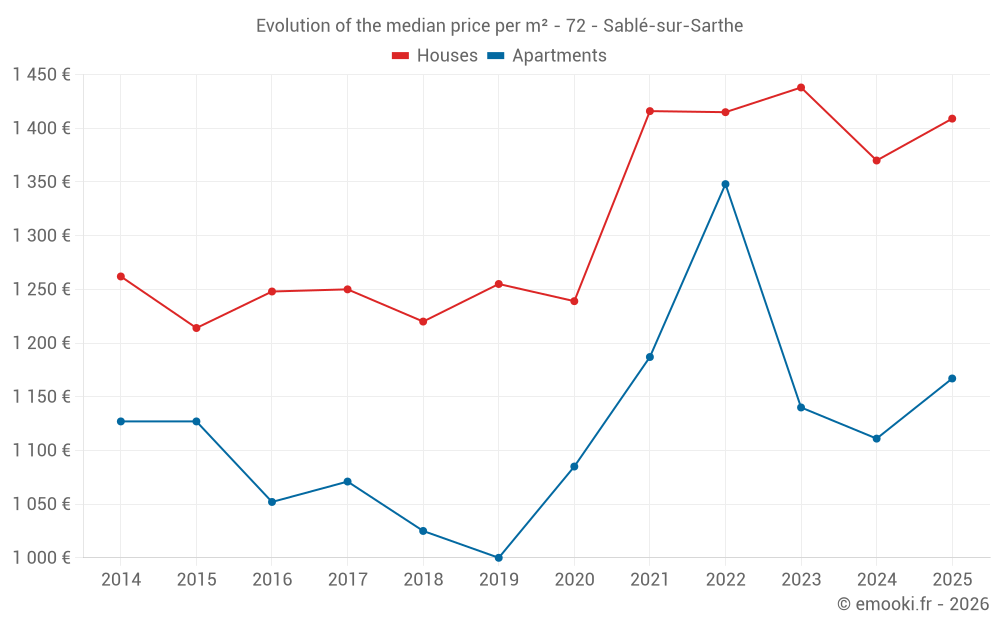
Median price of real estate
in the municipality of Sablé-sur-Sarthe

HousesHouses
1 409  /m²
1-23-45-67-89-10
Reliability 9/10
Median price on the 27 transactions of the last 6 months.
from 995 to
1 743  /m²
60% of transactions from the 2nd to the 8th deciles.
ApartmentsApartments
1 152  /m²
1-23-45-67-89-10
Reliability 8/10
Median price on the 32 transactions of the last 12 months.
from 1 025 to
1 545  /m²
60% of transactions from the 2nd to the 8th deciles.
DwellingsDwellings
1 398  /m²
1-23-45-67-89-10
Reliability 9/10
Median price on the 35 transactions of the last 6 months.
from 1 021 to
1 753  /m²
60% of transactions from the 2nd to the 8th deciles.
HousesEvolution of the price per m² of houses since...
1 year
+2.8%
2 years
-2%
3 years
-0.4%
4 years
-0.5%
5 years
+14%
6 years
+12%
7 years
+15%
8 years
+13%
9 years
+13%
10 years
+16%
11 years
+12%
The price per m² of houses has decreased by 2% since 2 years, but it has increased by 16% in 10 years.
ApartmentsEvolution of the price per m² of apartments since...
1 year
+5%
2 years
+2.4%
3 years
-13%
4 years
-1.7%
5 years
+7.6%
6 years
+17%
7 years
+14%
8 years
+9%
9 years
+11%
10 years
+3.5%
11 years
+3.5%
The price per m² of apartments has decreased by 13% since 3 years, but it has increased by 17% in 6 years.

Yearly evolution

Evolution of the median price per m²

Evolution of the number of transactions

Warning, last year incomplete. Projections made based on the proportions between semesters of the previous year at the departmental/national level and by type of property.

Yearly data

Descending order
Year
Houses
house
transactions
Houses
house
Price per m²
Apartments
apt.
transactions
Apartments
apt.
Price per m²
2025
27
1 409 
8
1 167 
2024
82
1 370 
37
1 111 
2023
95
1 438 
17
1 140 
2022
112
1 415 
33
1 348 
2021
120
1 416 
25
1 187 
2020
85
1 239 
26
1 085 
2019
102
1 255 
35
1 000 
2018
94
1 220 
21
1 025 
2017
97
1 250 
27
1 071 
2016
66
1 248 
16
1 052 
2015
89
1 214 
13
1 127 
2014
53
1 262 
19
1 127 

Analysis

Structure of prices per m²

Values of price percentiles per m² over the periods used for the estimated price of each type of property.

Structure of transaction amounts

Values of transaction amounts percentiles over the periods used for the estimated price of each type of property.

Transaction amounts and prices per m² by percentile

Ascending order
Percentile
Houses
house
Price per m²
Houses
house
Transaction amount
Apartments
apt.
Price per m²
Apartments
apt.
Transaction amount
10th percentile
856 
72 000 
945 
56 500 
20th percentile
995 
89 800 
1 025 
70 300 
30th percentile
1 224 
98 200 
1 052 
78 250 
40th percentile
1 380 
104 K
1 105 
82 450 
50th percentile
1 409 
114 K
1 152 
97 500 
60th percentile
1 537 
130 K
1 190 
111 K
70th percentile
1 709 
160 K
1 472 
127 K
80th percentile
1 743 
180 K
1 545 
140 K
90th percentile
1 821 
220 K
1 660 
196 K

National and departmental comparison

Evolution of the median price per m² of houses

Evolution of the median price per m² of apartments

Quarterly evolution

Evolution of the median price per m²

Evolution of the number of transactions

Quarterly data

Descending order
Quarter
Houses
house
transactions
Houses
house
Price per m²
Apartments
apt.
transactions
Apartments
apt.
Price per m²
2025 Q2
7
1 373 
4
1 066 
2025 Q1
20
1 428 
4
1 534 
2024 Q4
18
1 260 
11
1 190 
2024 Q3
24
1 434 
13
1 026 
2024 Q2
25
1 286 
6
741 
2024 Q1
15
1 429 
7
1 290 
2023 Q4
19
1 562 
9
1 306 
2023 Q3
30
1 480 
3
1 190 
2023 Q2
25
1 214 
2
804 
2023 Q1
21
1 308 
3
1 140 
2022 Q4
19
1 644 
10
1 482 
2022 Q3
31
1 538 
8
910 
2022 Q2
30
1 334 
8
1 360 
2022 Q1
32
1 330 
7
1 233 
2021 Q4
28
1 613 
4
807 
2021 Q3
35
1 391 
7
1 187 
2021 Q2
28
1 405 
11
1 197 
2021 Q1
29
1 304 
3
1 270 
2020 Q4
24
1 304 
10
1 035 
2020 Q3
22
1 292 
5
1 063 
2020 Q2
21
1 047 
8
1 226 
2020 Q1
18
1 324 
3
1 050 
2019 Q4
26
1 311 
14
934 
2019 Q3
26
1 152 
7
1 000 
2019 Q2
24
1 426 
6
1 109 
2019 Q1
26
1 255 
8
1 114 
2018 Q4
27
1 080 
6
1 181 
2018 Q3
21
1 348 
6
729 
2018 Q2
25
1 271 
7
1 062 
2018 Q1
21
1 103 
2
1 252 
2017 Q4
26
1 060 
4
950 
2017 Q3
30
1 314 
6
1 204 
2017 Q2
26
1 160 
6
1 311 
2017 Q1
15
1 176 
11
1 071 
2016 Q4
12
1 261 
3
1 026 
2016 Q3
22
1 210 
4
949 
2016 Q2
14
1 252 
4
1 079 
2016 Q1
18
1 350 
5
1 226 
2015 Q4
27
1 179 
4
1 232 
2015 Q3
25
1 204 
3
1 153 
2015 Q2
21
1 104 
6
636 
2015 Q1
16
1 399 
0
--- 
2014 Q4
10
1 100 
6
1 177 
2014 Q3
17
1 273 
4
1 116 
2014 Q2
11
1 500 
3
1 067 
2014 Q1
15
1 316 
6
1 145 

Overview of the latest real estate transactions

The following list is an anonymized overview of the latest transactions. For more details and to find all transactions, please use the map to view transactions by plot or the transaction search page for a search by criteria.

2025-06-20
8 000 
Sale
Land
500 m2
-Jardins
/Jardin potager
2025-05-07
15 
Sale
Land
933 m2
-Sols
2025-05-05
99 000 
1 707  /m²(58 m²)
Sale
Houses
House
4 rooms
58 m2
1 outbuilding
Land
169 m2
-Sols
2025-04-30
30 000 
142  /m²(212 m²)
345  /m²(87 m²)
Sale
Houses
House
6 rooms
87 m2
Commercial property
125 m2
1 outbuilding
Land
100 m2
-Sols
Land
11 m2
-Sols
2025-04-30
250 000 
1 033  /m²(242 m²)
Sale
Apartments
Apartment
3 rooms
77 m2
Apartments
Apartment
3 rooms
80 m2
Apartments
Apartment
3 rooms
85 m2
Land
118 m2
-Sols
Land
83 m2
-Jardins
/Jardin potager
Land
111 m2
-Jardins
/Jardin potager
Land
55 m2
-Sols
Land
466 m2
-Sols
2025-04-30
210 000 
1 373  /m²(153 m²)
Sale
Houses
House
5 rooms
153 m2
4 outbuildings
Land
522 m2
-Sols
Land
1365 m2
-Jardins
/Jardin potager
2025-04-30
49 000 
Sale
Land
31 m2
-Prés
Land
47 m2
-Terrains à bâtir
Land
556 m2
-Terrains à bâtir
2025-04-29
30 000 
612  /m²(49 m²)
Sale
Houses
House
3 rooms
49 m2
Land
374 m2
-Sols
2025-04-29
178 000 
2 046  /m²(87 m²)
Sale
Houses
House
4 rooms
87 m2
Land
515 m2
-Sols
2025-04-29
85 000 
1 466  /m²(58 m²)
Sale
Apartments
Apartment
2 rooms
58 m2
2 outbuildings
2025-04-28
100 000 
1 087  /m²(92 m²)
Sale
Houses
House
5 rooms
92 m2
Land
76 m2
-Sols
Land
81 m2
-Sols
2025-04-28
120 000 
857  /m²(140 m²)
Sale
Land
93 m2
-Sols
Land
305 m2
-Sols
Apartments
Apartment
2 rooms
70 m2
Apartments
Apartment
3 rooms
70 m2
2 outbuildings
Land
107 m2
-Sols
Land
277 m2
-Jardins
/Jardin potager
Land
164 m2
-Sols
Land
129 m2
-Sols
2025-04-25
100 000 
1 235  /m²(81 m²)
Sale
Houses
House
5 rooms
81 m2
Land
147 m2
-Sols
2025-04-15
130 000 
1 781  /m²(73 m²)
Sale
Houses
House
4 rooms
73 m2
1 outbuilding
Land
1142 m2
-Sols
2025-04-14
48 371 
Sale
1 outbuilding
Land
11 m2
-Sols
1 outbuilding
Land
394 m2
-Sols
Land
393 m2
-Jardins
/Jardin potager
Land
143 m2
-Sols
Land
141 m2
-Jardins
/Jardin potager
Land
369 m2
-Jardins
/Jardin potager
Land
135 m2
-Jardins
/Jardin potager
Land
134 m2
-Jardins
/Jardin potager
2025-04-09
56 000 
1 098  /m²(51 m²)
Sale
Apartments
Apartment
2 rooms
51 m2
2025-03-31
40 000 
Sale
1 outbuilding
Land
67 m2
-Sols
2025-03-31
1 430 000 
691  /m²(2070 m²)
Sale
Commercial property
2070 m2
Land
7314 m2
-Sols
2025-03-28
235 000 
1 880  /m²(125 m²)
Sale
Houses
House
6 rooms
125 m2
Land
522 m2
-Sols
2025-03-27
29 103 
Sale
Land
438 m2
-Terrains à bâtir
1854 transactions listed in the municipality

Sarthe (72)

Most expensive cities

City
name
Descending orderHouses
house
Price per m²
2 340 
2 248 
2 190 
2 177 
2 167 
2 164 
City
name
Descending orderApartments
apt.
Price per m²
5 702 
2 111 
1 884 
1 726 
1 692 
1 651 

Least expensive cities

City
name
Ascending orderHouses
house
Price per m²
366 
538 
600 
612 
668 
City
name
Ascending orderApartments
apt.
Price per m²
172 
270 
313