emooki
HomePrice mapTransactions
🇬🇧 English🇫🇷 Français🇩🇪 Deutsch🇪🇸 Español🇮🇹 Italiano

Real estate price map


Real estate price map in the municipality of Parcé-sur-Sarthe.

Sarthe (72)
Parcé-sur-Sarthe

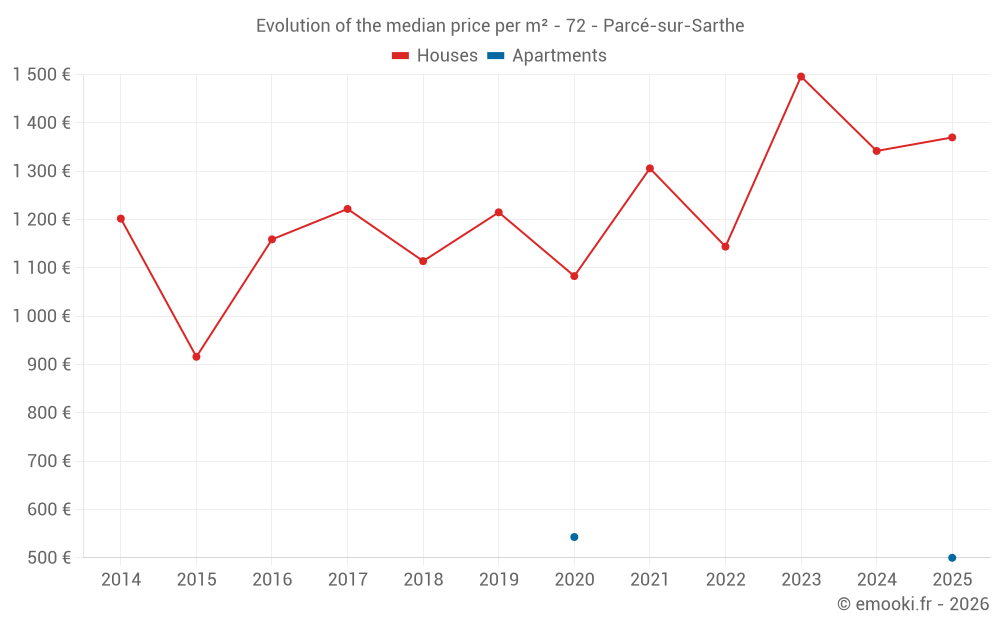
Median price of real estate
in the municipality of Parcé-sur-Sarthe

HousesHouses
1 222  /m²
1-23-45-67-89-10
Reliability 8/10
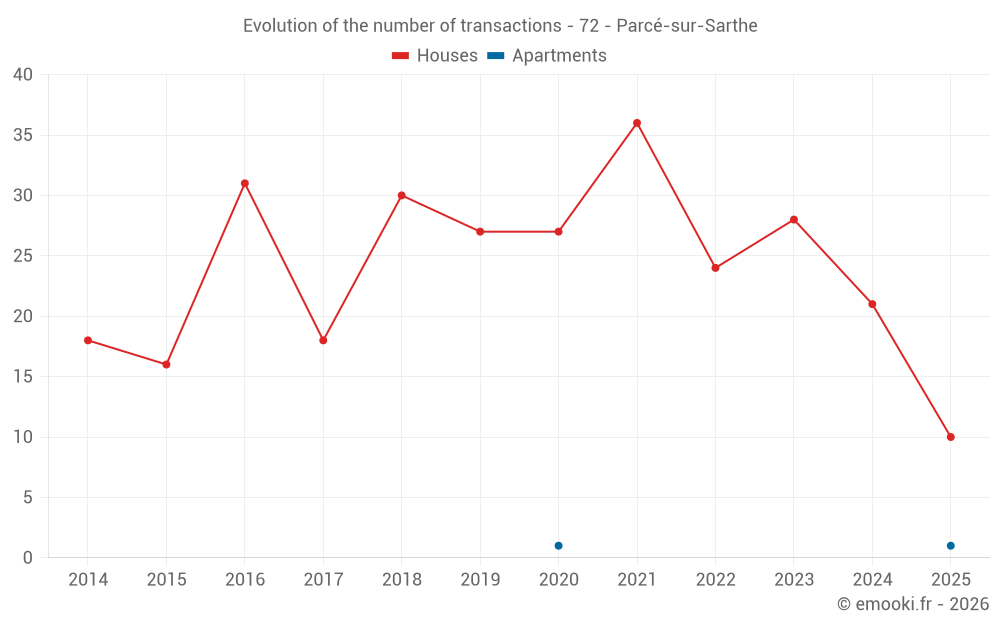
Median price on the 21 transactions of the last 12 months.
from 611 to
1 727  /m²
60% of transactions from the 2nd to the 8th deciles.
ApartmentsApartments
522  /m²
1-23-45-67-89-10
Reliability 1/10
Median price on the 2 transactions of the last 120 months.
DwellingsDwellings
1 217  /m²
1-23-45-67-89-10
Reliability 8/10
Median price on the 22 transactions of the last 12 months.
from 522 to
1 695  /m²
60% of transactions from the 2nd to the 8th deciles.
HousesEvolution of the price per m² of houses since...
1 year
+2.1%
2 years
-8.4%
3 years
+20%
4 years
+4.9%
5 years
+27%
6 years
+13%
7 years
+23%
8 years
+12%
9 years
+18%
10 years
+50%
11 years
+14%
ApartmentsEvolution of the price per m² of apartments since...
1 year
--
2 years
--
3 years
--
4 years
--
5 years
--
6 years
--
7 years
--
8 years
--
9 years
--
10 years
--
11 years
--

Yearly evolution

Evolution of the median price per m²

Evolution of the number of transactions

Warning, last year incomplete. Projections made based on the proportions between semesters of the previous year at the departmental/national level and by type of property.

Yearly data

Descending order
Year
Houses
house
transactions
Houses
house
Price per m²
Apartments
apt.
transactions
Apartments
apt.
Price per m²
2025
10
1 370 
1
500 
2024
21
1 342 
0
--- 
2023
28
1 496 
0
--- 
2022
24
1 144 
0
--- 
2021
36
1 306 
0
--- 
2020
27
1 083 
1
543 
2019
27
1 215 
0
--- 
2018
30
1 114 
0
--- 
2017
18
1 222 
0
--- 
2016
31
1 159 
0
--- 
2015
16
916 
0
--- 
2014
18
1 202 
0
--- 

Analysis

Structure of prices per m²

Values of price percentiles per m² over the periods used for the estimated price of each type of property.

Structure of transaction amounts

Values of transaction amounts percentiles over the periods used for the estimated price of each type of property.

Transaction amounts and prices per m² by percentile

Ascending order
Percentile
Houses
house
Price per m²
Houses
house
Transaction amount
Apartments
apt.
Price per m²
Apartments
apt.
Transaction amount
10th percentile
336 
33 500 
504 
53 779 
20th percentile
611 
55 000 
509 
59 559 
30th percentile
1 023 
80 000 
513 
65 338 
40th percentile
1 210 
100 K
517 
71 117 
50th percentile
1 222 
124 K
522 
76 896 
60th percentile
1 531 
145 K
526 
82 676 
70th percentile
1 548 
147 K
530 
88 455 
80th percentile
1 727 
153 K
534 
94 234 
90th percentile
1 959 
192 K
539 
100 K

National and departmental comparison

Evolution of the median price per m² of houses

Evolution of the median price per m² of apartments

Quarterly evolution

Evolution of the median price per m²

Evolution of the number of transactions

Quarterly data

Descending order
Quarter
Houses
house
transactions
Houses
house
Price per m²
Apartments
apt.
transactions
Apartments
apt.
Price per m²
2025 Q2
3
1 727 
0
--- 
2025 Q1
7
1 023 
1
500 
2024 Q4
7
1 532 
0
--- 
2024 Q3
4
774 
0
--- 
2024 Q2
5
1 667 
0
--- 
2024 Q1
5
2 059 
0
--- 
2023 Q4
3
1 598 
0
--- 
2023 Q3
8
1 326 
0
--- 
2023 Q2
7
1 446 
0
--- 
2023 Q1
10
1 810 
0
--- 
2022 Q4
6
1 348 
0
--- 
2022 Q3
8
1 218 
0
--- 
2022 Q2
7
882 
0
--- 
2022 Q1
3
1 176 
0
--- 
2021 Q4
8
1 359 
0
--- 
2021 Q3
7
1 194 
0
--- 
2021 Q2
11
1 360 
0
--- 
2021 Q1
10
1 262 
0
--- 
2020 Q4
13
1 215 
0
--- 
2020 Q3
5
944 
1
543 
2020 Q2
6
598 
0
--- 
2020 Q1
3
1 591 
0
--- 
2019 Q4
10
1 163 
0
--- 
2019 Q3
2
1 770 
0
--- 
2019 Q2
8
1 272 
0
--- 
2019 Q1
7
1 000 
0
--- 
2018 Q4
5
1 103 
0
--- 
2018 Q3
10
1 130 
0
--- 
2018 Q2
7
1 167 
0
--- 
2018 Q1
8
1 115 
0
--- 
2017 Q4
5
1 142 
0
--- 
2017 Q3
9
1 124 
0
--- 
2017 Q2
3
1 467 
0
--- 
2017 Q1
1
2 465 
0
--- 
2016 Q4
5
1 145 
0
--- 
2016 Q3
9
1 319 
0
--- 
2016 Q2
14
1 142 
0
--- 
2016 Q1
3
856 
0
--- 
2015 Q4
5
1 051 
0
--- 
2015 Q3
3
1 183 
0
--- 
2015 Q2
2
1 441 
0
--- 
2015 Q1
6
786 
0
--- 
2014 Q4
4
1 305 
0
--- 
2014 Q3
8
1 078 
0
--- 
2014 Q2
4
706 
0
--- 
2014 Q1
2
1 362 
0
--- 

Sarthe (72)

Most expensive cities

City
name
Descending orderHouses
house
Price per m²
2 340 
2 248 
2 190 
2 177 
2 167 
2 164 
City
name
Descending orderApartments
apt.
Price per m²
5 702 
2 111 
1 884 
1 726 
1 692 
1 651 

Least expensive cities

City
name
Ascending orderHouses
house
Price per m²
366 
538 
600 
612 
668 
City
name
Ascending orderApartments
apt.
Price per m²
172 
270 
313