emooki
HomePrice mapTransactions
🇬🇧 English🇫🇷 Français🇩🇪 Deutsch🇪🇸 Español🇮🇹 Italiano

Real estate price map


Real estate price map in the municipality of Verzé.

Saône-et-Loire (71)
Verzé

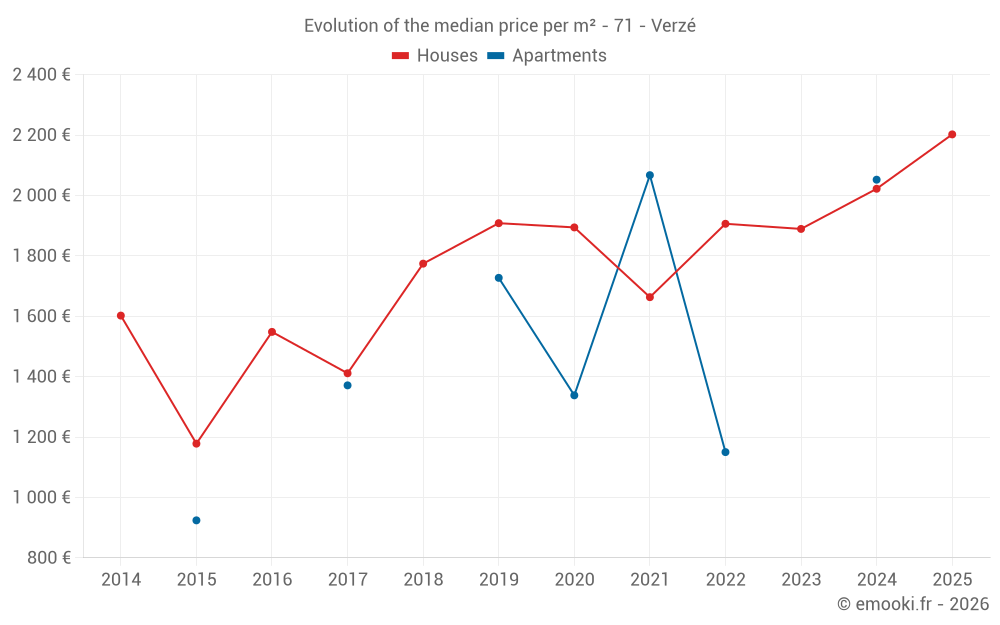
Median price of real estate
in the municipality of Verzé

HousesHouses
1 990  /m²
1-23-45-67-89-10
Reliability 7/10
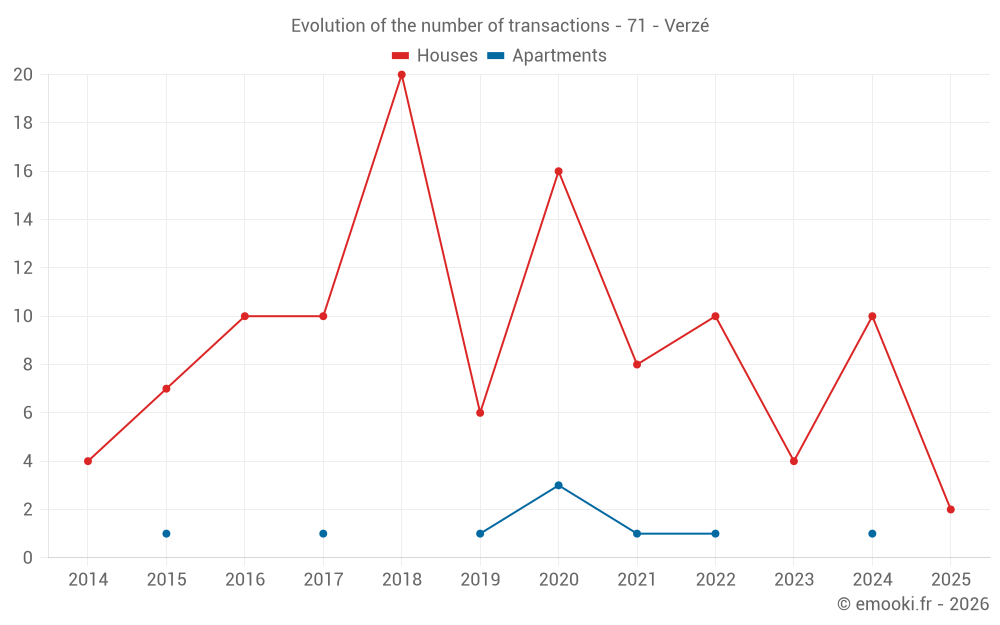
Median price on the 14 transactions of the last 24 months.
from 1 429 to
3 272  /m²
60% of transactions from the 2nd to the 8th deciles.
ApartmentsApartments
1 593  /m²
1-23-45-67-89-10
Reliability 3/10
Median price on the 7 transactions of the last 72 months.
DwellingsDwellings
2 052  /m²
1-23-45-67-89-10
Reliability 7/10
Median price on the 15 transactions of the last 24 months.
from 1 499 to
3 237  /m²
60% of transactions from the 2nd to the 8th deciles.
HousesEvolution of the price per m² of houses since...
1 year
--
2 years
--
3 years
--
4 years
--
5 years
--
6 years
--
7 years
--
8 years
--
9 years
--
10 years
--
11 years
--
ApartmentsEvolution of the price per m² of apartments since...
1 year
--
2 years
--
3 years
--
4 years
--
5 years
--
6 years
--
7 years
--
8 years
--
9 years
--
10 years
--
11 years
--

Yearly evolution

Evolution of the median price per m²

Evolution of the number of transactions

Warning, last year incomplete. Projections made based on the proportions between semesters of the previous year at the departmental/national level and by type of property.

Yearly data

Descending order
Year
Houses
house
transactions
Houses
house
Price per m²
Apartments
apt.
transactions
Apartments
apt.
Price per m²
2025
2
2 202 
0
--- 
2024
10
2 022 
1
2 052 
2023
4
1 889 
0
--- 
2022
10
1 906 
1
1 150 
2021
8
1 663 
1
2 067 
2020
16
1 894 
3
1 338 
2019
6
1 908 
1
1 727 
2018
20
1 774 
0
--- 
2017
10
1 411 
1
1 371 
2016
10
1 548 
0
--- 
2015
7
1 178 
1
924 
2014
4
1 602 
0
--- 

Analysis

Structure of prices per m²

Values of price percentiles per m² over the periods used for the estimated price of each type of property.

Structure of transaction amounts

Values of transaction amounts percentiles over the periods used for the estimated price of each type of property.

Transaction amounts and prices per m² by percentile

Ascending order
Percentile
Houses
house
Price per m²
Houses
house
Transaction amount
Apartments
apt.
Price per m²
Apartments
apt.
Transaction amount
10th percentile
1 065 
107 K
1 090 
164 K
20th percentile
1 429 
132 K
1 188 
170 K
30th percentile
1 692 
150 K
1 300 
182 K
40th percentile
1 775 
153 K
1 440 
188 K
50th percentile
1 990 
167 K
1 593 
191 K
60th percentile
2 106 
188 K
1 673 
198 K
70th percentile
3 189 
233 K
1 792 
208 K
80th percentile
3 272 
380 K
1 987 
224 K
90th percentile
3 514 
534 K
2 058 
259 K

National and departmental comparison

Evolution of the median price per m² of houses

Evolution of the median price per m² of apartments

Quarterly evolution

Evolution of the median price per m²

Evolution of the number of transactions

Quarterly data

Descending order
Quarter
Houses
house
transactions
Houses
house
Price per m²
Apartments
apt.
transactions
Apartments
apt.
Price per m²
2025 Q2
2
2 202 
0
--- 
2024 Q4
2
916 
0
--- 
2024 Q3
4
1 831 
0
--- 
2024 Q2
1
3 375 
1
2 052 
2024 Q1
3
3 203 
0
--- 
2023 Q4
2
1 880 
0
--- 
2023 Q2
1
1 723 
0
--- 
2023 Q1
1
2 628 
0
--- 
2022 Q4
1
1 850 
1
1 150 
2022 Q3
2
1 665 
0
--- 
2022 Q2
2
1 844 
0
--- 
2022 Q1
5
2 633 
0
--- 
2021 Q4
2
2 394 
1
2 067 
2021 Q3
3
1 940 
0
--- 
2021 Q2
1
882 
0
--- 
2021 Q1
2
1 336 
0
--- 
2020 Q4
6
1 526 
2
1 169 
2020 Q3
6
1 967 
1
1 593 
2020 Q2
2
1 358 
0
--- 
2020 Q1
2
1 770 
0
--- 
2019 Q4
1
1 794 
1
1 727 
2019 Q3
3
2 178 
0
--- 
2019 Q1
2
1 410 
0
--- 
2018 Q4
14
1 900 
0
--- 
2018 Q3
3
1 626 
0
--- 
2018 Q2
3
1 592 
0
--- 
2017 Q4
1
1 240 
0
--- 
2017 Q3
3
1 743 
1
1 371 
2017 Q2
3
1 212 
0
--- 
2017 Q1
3
1 121 
0
--- 
2016 Q4
2
979 
0
--- 
2016 Q3
4
1 257 
0
--- 
2016 Q2
3
1 579 
0
--- 
2016 Q1
1
2 591 
0
--- 
2015 Q4
1
2 294 
0
--- 
2015 Q3
3
1 111 
0
--- 
2015 Q2
1
1 178 
0
--- 
2015 Q1
2
1 528 
1
924 
2014 Q4
1
1 965 
0
--- 
2014 Q3
1
1 240 
0
--- 
2014 Q1
2
2 314 
0
--- 

Saône-et-Loire (71)

Most expensive cities

City
name
Descending orderHouses
house
Price per m²
2 677 
2 667 
2 604 
2 570 
2 554 
2 508 
City
name
Descending orderApartments
apt.
Price per m²
6 368 
5 118 
3 333 
3 131 
2 806 
2 450 
2 303 

Least expensive cities

City
name
Ascending orderHouses
house
Price per m²
646 
690 
706 
708 
710 
City
name
Ascending orderApartments
apt.
Price per m²
154 
159 
191 
218