Real estate price map
Real estate price map in the municipality of Verjux, choose a section to see transactions by parcel.
Saône-et-Loire (71)
Price per m² in Verjux
Median price of real estate
in the municipality of Verjux
Houses
1 629 € /m²
Reliability 6/10
Median price on the 17 transactions of the last 36 months.
from 547 to
1 884 € /m²
1 884 € /m²
60% of transactions from the 2nd to the 8th deciles.
Apartments
1 032 € /m²
Reliability 1/10
Price of the unique transaction of the last 120 months.
Dwellings
1 629 € /m²
Reliability 6/10
Median price on the 17 transactions of the last 36 months.
from 547 to
1 884 € /m²
1 884 € /m²
60% of transactions from the 2nd to the 8th deciles.
Yearly evolution
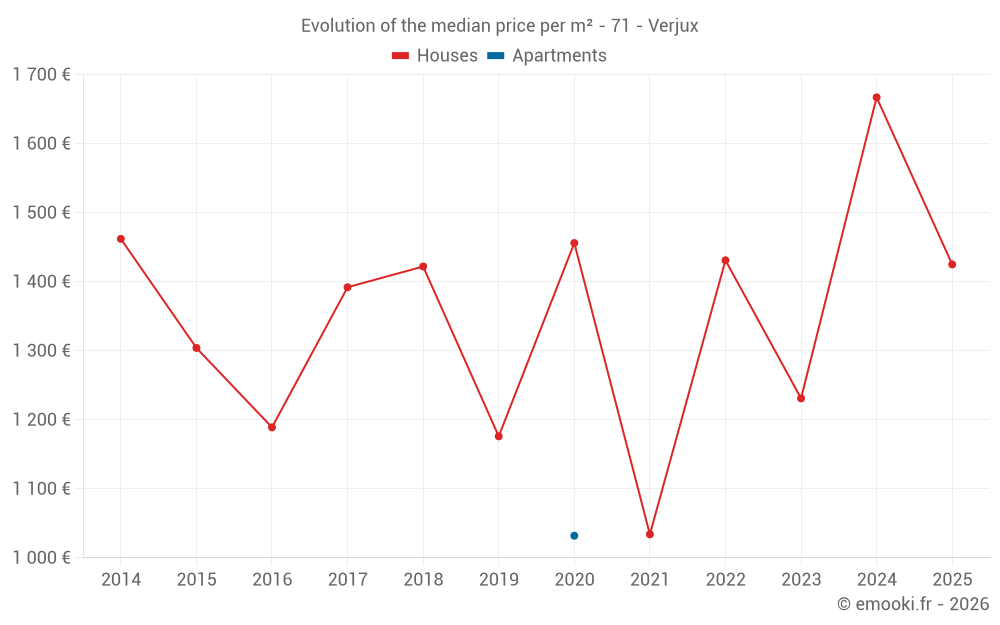
Evolution of the median price per m²
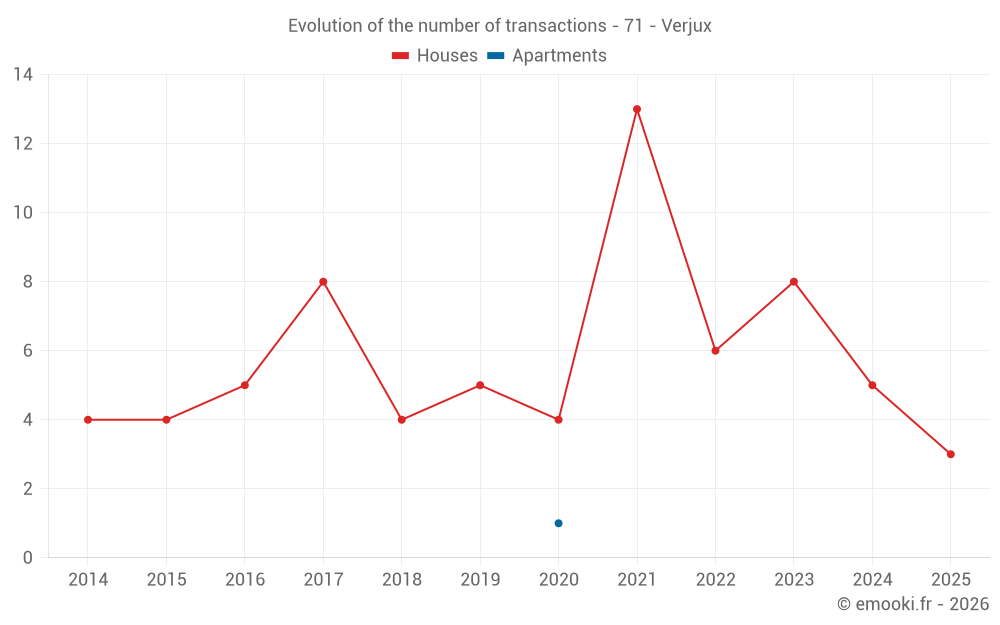
Evolution of the number of transactions
Warning, last year incomplete. Projections made based on the proportions between semesters of the previous year at the departmental/national level and by type of property.
Yearly data
Year
house
transactions
transactions
house
Price per m²
Price per m²
apt.
transactions
transactions
apt.
Price per m²
Price per m²
2025
3
1 425 €
0
--- €
2024
5
1 667 €
0
--- €
2023
8
1 231 €
0
--- €
2022
6
1 431 €
0
--- €
2021
13
1 034 €
0
--- €
2020
4
1 456 €
1
1 032 €
2019
5
1 176 €
0
--- €
2018
4
1 422 €
0
--- €
2017
8
1 392 €
0
--- €
2016
5
1 189 €
0
--- €
2015
4
1 304 €
0
--- €
2014
4
1 462 €
0
--- €
Analysis
Structure of prices per m²
Values of price percentiles per m² over the periods used for the estimated price of each type of property.
Structure of transaction amounts
Values of transaction amounts percentiles over the periods used for the estimated price of each type of property.
Transaction amounts and prices per m² by percentile
Percentile
house
Price per m²
Price per m²
house
Transaction amount
Transaction amount
apt.
Price per m²
Price per m²
apt.
Transaction amount
Transaction amount
10th percentile
277 €
11 480 €
1 032 €
128 K€
20th percentile
547 €
16 000 €
1 032 €
128 K€
30th percentile
801 €
22 800 €
1 032 €
128 K€
40th percentile
1 070 €
37 200 €
1 032 €
128 K€
50th percentile
1 629 €
64 600 €
1 032 €
128 K€
60th percentile
1 667 €
109 K€
1 032 €
128 K€
70th percentile
1 745 €
160 K€
1 032 €
128 K€
80th percentile
1 884 €
189 K€
1 032 €
128 K€
90th percentile
2 577 €
214 K€
1 032 €
128 K€
National and departmental comparison
Evolution of the median price per m² of houses
Evolution of the median price per m² of apartments
Quarterly evolution
Evolution of the median price per m²
Evolution of the number of transactions
Quarterly data
Quarter
house
transactions
transactions
house
Price per m²
Price per m²
apt.
transactions
transactions
apt.
Price per m²
Price per m²
2025 Q2
1
1 425 €
0
--- €
2025 Q1
2
1 665 €
0
--- €
2024 Q4
1
1 741 €
0
--- €
2024 Q3
4
1 667 €
0
--- €
2023 Q4
2
613 €
0
--- €
2023 Q3
3
1 915 €
0
--- €
2023 Q2
1
1 629 €
0
--- €
2023 Q1
2
1 329 €
0
--- €
2022 Q3
1
808 €
0
--- €
2022 Q2
4
1 431 €
0
--- €
2022 Q1
1
1 714 €
0
--- €
2021 Q4
3
1 768 €
0
--- €
2021 Q3
3
1 205 €
0
--- €
2021 Q2
6
962 €
0
--- €
2021 Q1
1
678 €
0
--- €
2020 Q3
3
1 402 €
1
1 032 €
2020 Q1
1
1 510 €
0
--- €
2019 Q3
2
852 €
0
--- €
2019 Q2
2
1 627 €
0
--- €
2019 Q1
1
1 122 €
0
--- €
2018 Q4
1
1 367 €
0
--- €
2018 Q2
2
1 570 €
0
--- €
2018 Q1
1
1 104 €
0
--- €
2017 Q4
4
1 428 €
0
--- €
2017 Q3
2
1 164 €
0
--- €
2017 Q1
2
1 522 €
0
--- €
2016 Q4
1
1 189 €
0
--- €
2016 Q3
1
1 018 €
0
--- €
2016 Q2
2
1 122 €
0
--- €
2016 Q1
1
1 221 €
0
--- €
2015 Q4
2
1 402 €
0
--- €
2015 Q2
1
1 656 €
0
--- €
2015 Q1
1
904 €
0
--- €
2014 Q2
1
1 138 €
0
--- €
2014 Q1
3
1 617 €
0
--- €
Overview of the latest real estate transactions
The following list is an anonymized overview of the latest transactions. For more details and to find all transactions, please use the map to view transactions by plot or the transaction search page for a search by criteria.
2025-06-20
158 150 €1 425 € /m²(111 m²)
Sale
House
1 room
28 m2
House
4 rooms
83 m2
Land
75 m2
-Sols
2025-04-24
18 570 €Sale
Land
13332 m2
-Terres
Land
1104 m2
-Taillis simples
/Acacias
Land
690 m2
-Terres
Land
2070 m2
-Terres
Land
507 m2
-Terres
Land
6973 m2
-Prés
Land
11595 m2
-Prés
Land
3881 m2
-Prés
Land
1755 m2
-Terres
Land
5432 m2
-Terres
Land
1358 m2
-Terres
Land
947 m2
-Terres
Land
12100 m2
-Terres
2025-04-10
500 €Exchange
Land
10 m2
-Sols
Land
4 m2
-Sols
2025-03-24
224 900 €2 556 € /m²(88 m²)
Sale
House
4 rooms
88 m2
Land
2243 m2
-Jardins
Land
500 m2
-Sols
2025-02-13
1 €Sale
Land
799 m2
-Terres
2025-01-20
65 000 €774 € /m²(84 m²)
Sale
House
2 rooms
34 m2
1 outbuilding
Land
201 m2
-Sols
House
3 rooms
50 m2
Land
304 m2
-Sols
2024-10-21
3 400 €Sale
Land
2580 m2
-Prés
2024-10-11
195 000 €1 741 € /m²(112 m²)
Sale
House
5 rooms
112 m2
Land
4269 m2
-Terres
Land
1000 m2
-Sols
Land
215 m2
-Terres
2024-09-27
500 €Sale
Land
26 m2
-Terres
2024-09-27
23 500 €490 € /m²(48 m²)
Sale
House
1 room
48 m2
Land
263 m2
-Sols
2024-09-09
15 000 €1 667 € /m²(9 m²)
Sale
House
1 room
9 m2
Land
243 m2
-Sols
Land
459 m2
-Terres
2024-09-04
230 600 €1 760 € /m²(131 m²)
Sale
House
5 rooms
131 m2
Land
616 m2
-Pâtures
/Pâture plantée
Land
337 m2
-Sols
2024-07-10
15 000 €1 667 € /m²(9 m²)
Sale
House
1 room
9 m2
Land
243 m2
-Sols
Land
459 m2
-Terres
2024-05-13
27 900 €Sale
2 outbuildings
Land
465 m2
-Jardins
Land
1000 m2
-Sols
2024-02-02
400 €Sale
Land
1312 m2
-Terres
2024-01-26
205 €Sale
Land
2183 m2
-Pâtures
/Pâture plantée
Land
1945 m2
-Taillis simples
2023-11-27
1 500 €Sale
Land
3780 m2
-Terres
Land
1361 m2
-Terres
2023-11-27
24 000 €393 € /m²(61 m²)
Sale
House
1 room
61 m2
1 outbuilding
Land
1570 m2
-Sols
2023-11-03
2 600 €Sale
Land
5310 m2
-Prés
Land
3372 m2
-Peupleraies
2023-10-26
26 306 €Sale
Land
19368 m2
-Terres
Land
12982 m2
-Terres
Land
16584 m2
-Terres
Land
16626 m2
-Terres
Land
5542 m2
-Terres
122 transactions listed in the municipality
Compare with neighboring municipalities
City
name
name
house
Price per m²
Price per m²
apt.
Price per m²
Price per m²
City information
Zip code
- 71590 VERJUX
Data source & update
- Latest publication of the property value request (DVF) database made available by the DGFiP on October 19, 2025, covering transactions up to 06/30/2025:
- Administrative/cadastral division as of September 1, 2025, and municipal movements as of January 1, 2025: