emooki
HomePrice mapTransactions
🇬🇧 English🇫🇷 Français🇩🇪 Deutsch🇪🇸 Español🇮🇹 Italiano

Real estate price map


Real estate price map in the municipality of Pierre-de-Bresse.

Saône-et-Loire (71)
Pierre-de-Bresse

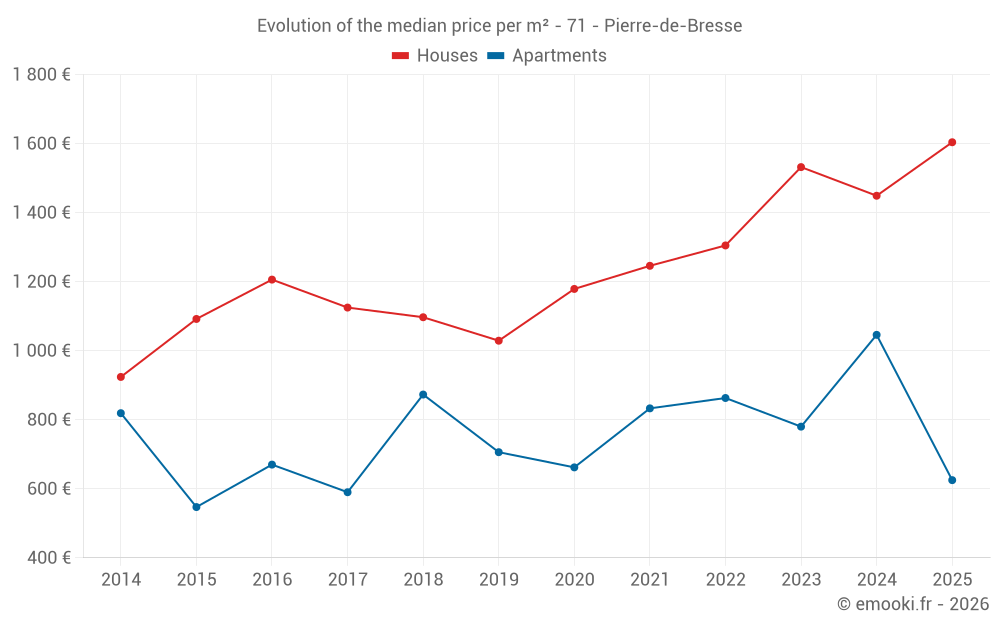
Median price of real estate
in the municipality of Pierre-de-Bresse

HousesHouses
1 518 € /m²
1-23-45-67-89-10
Reliability 8/10
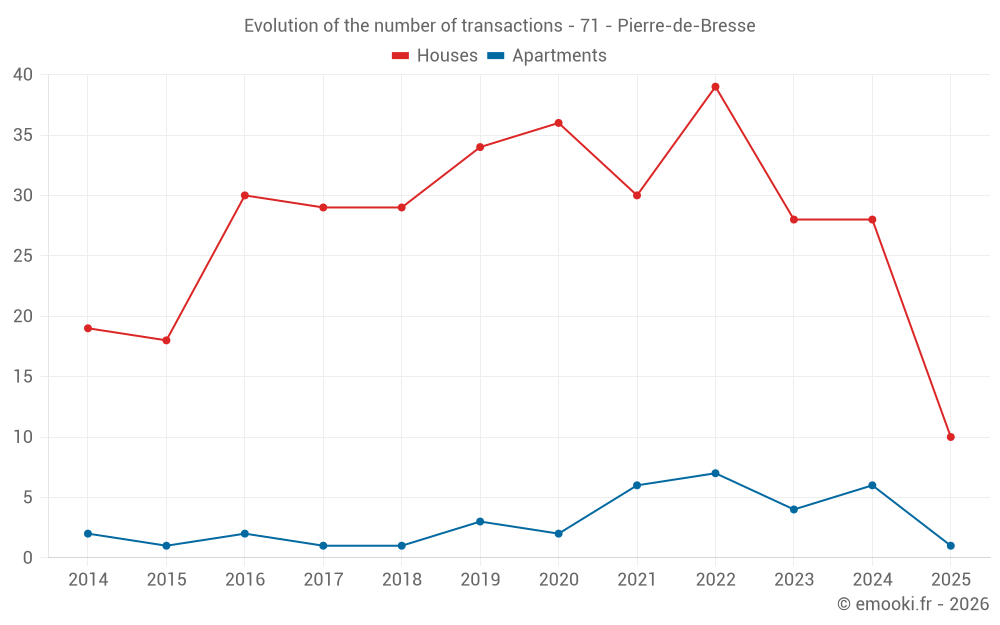
Median price on the 24 transactions of the last 12 months.
from 1 203 to
1 959 € /m²
60% of transactions from the 2nd to the 8th deciles.
ApartmentsApartments
863 € /m²
1-23-45-67-89-10
Reliability 6/10
Median price on the 13 transactions of the last 36 months.
from 635 to
1 093 € /m²
60% of transactions from the 2nd to the 8th deciles.
DwellingsDwellings
1 370 € /m²
1-23-45-67-89-10
Reliability 8/10
Median price on the 30 transactions of the last 12 months.
from 997 to
1 869 € /m²
60% of transactions from the 2nd to the 8th deciles.
HousesEvolution of the price per m² of houses
1 year
+11%
2 years
+4.7%
3 years
+23%
4 years
+29%
5 years
+36%
6 years
+56%
7 years
+46%
8 years
+43%
9 years
+33%
10 years
+47%
11 years
+74%
ApartmentsEvolution of the price per m² of apartments
1 year
--
2 years
--
3 years
--
4 years
--
5 years
--
6 years
--
7 years
--
8 years
--
9 years
--
10 years
--
11 years
--

Yearly evolution

Median price per m²

Number of transactions

Warning, last year incomplete. Projections made based on the proportions between semesters of the previous year at the departmental/national level and by type of property.

Yearly data

Descending order
Year
Houses
house
Price per m²
Houses
house
transactions
Apartments
apt.
Price per m²
Apartments
apt.
transactions
2025
1 604 €
10
625 €
1
2024
1 449 €
28
1 046 €
6
2023
1 532 €
28
780 €
4
2022
1 305 €
39
863 €
7
2021
1 246 €
30
833 €
6
2020
1 179 €
36
662 €
2
2019
1 029 €
34
706 €
3
2018
1 097 €
29
873 €
1
2017
1 125 €
29
590 €
1
2016
1 206 €
30
670 €
2
2015
1 092 €
18
547 €
1
2014
924 €
19
819 €
2

Analysis

Structure of prices per m²

Values of price percentiles per m² over the periods used for the estimated price of each type of property.

Structure of transaction amounts

Values of transaction amounts percentiles over the periods used for the estimated price of each type of property.

Transaction amounts and prices per m² by percentile

Ascending order
Percentile
Houses
house
Price per m²
Houses
house
Transaction amount
Apartments
apt.
Price per m²
Apartments
apt.
Transaction amount
10th percentile
946 €
79 100 €
579 €
48 640 €
20th percentile
1 203 €
99 060 €
635 €
52 000 €
30th percentile
1 332 €
120 332 €
688 €
55 000 €
40th percentile
1 396 €
127 000 €
788 €
63 000 €
50th percentile
1 518 €
150 150 €
863 €
66 000 €
60th percentile
1 725 €
158 300 €
926 €
71 800 €
70th percentile
1 828 €
180 050 €
1 028 €
75 400 €
80th percentile
1 959 €
191 000 €
1 093 €
86 200 €
90th percentile
2 081 €
224 000 €
1 220 €
102 600 €

Quarterly evolution

Median price per m²

Number of transactions

Quarterly data

Descending order
Quarter
Houses
house
Price per m²
Houses
house
transactions
Apartments
apt.
Price per m²
Apartments
apt.
transactions
2025 Q2
1 193 €
2
625 €
1
2025 Q1
1 704 €
8
--- €
0
2024 Q4
1 576 €
8
1 175 €
4
2024 Q3
1 424 €
6
991 €
1
2024 Q2
1 494 €
8
714 €
1
2024 Q1
1 268 €
6
--- €
0
2023 Q4
1 760 €
6
--- €
0
2023 Q3
1 312 €
8
910 €
3
2023 Q2
1 581 €
4
650 €
1
2023 Q1
1 172 €
10
--- €
0
2022 Q4
1 372 €
14
863 €
1
2022 Q3
1 278 €
10
294 €
1
2022 Q2
1 366 €
13
1 140 €
3
2022 Q1
772 €
2
602 €
2
2021 Q4
1 457 €
7
750 €
1
2021 Q3
1 316 €
4
--- €
0
2021 Q2
1 049 €
14
833 €
3
2021 Q1
1 274 €
5
1 052 €
2
2020 Q4
1 190 €
10
992 €
1
2020 Q3
1 189 €
17
--- €
0
2020 Q2
1 012 €
5
331 €
1
2020 Q1
1 216 €
4
--- €
0
2019 Q4
691 €
10
--- €
0
2019 Q3
891 €
8
--- €
0
2019 Q2
1 029 €
6
830 €
2
2019 Q1
1 278 €
10
594 €
1
2018 Q4
895 €
7
--- €
0
2018 Q3
1 192 €
8
--- €
0
2018 Q2
1 190 €
10
--- €
0
2018 Q1
1 077 €
4
873 €
1
2017 Q4
1 267 €
7
--- €
0
2017 Q3
1 056 €
12
--- €
0
2017 Q2
621 €
5
--- €
0
2017 Q1
1 389 €
5
590 €
1
2016 Q4
1 146 €
12
--- €
0
2016 Q3
1 338 €
9
944 €
1
2016 Q2
1 186 €
4
397 €
1
2016 Q1
854 €
5
--- €
0
2015 Q4
964 €
6
--- €
0
2015 Q3
868 €
4
547 €
1
2015 Q2
1 330 €
3
--- €
0
2015 Q1
1 276 €
5
--- €
0
2014 Q4
1 120 €
6
--- €
0
2014 Q3
937 €
4
--- €
0
2014 Q2
781 €
7
819 €
2
2014 Q1
636 €
2
--- €
0

Saône-et-Loire (71)

Most expensive cities

City
name
Descending orderHouses
house
Price per m²
3 557 €
2 680 €
2 677 €
2 667 €
2 622 €
2 604 €
2 570 €
2 554 €
2 551 €
2 508 €
City
name
Descending orderApartments
apt.
Price per m²
6 368 €
5 118 €
3 333 €
3 269 €
3 131 €
2 806 €
2 450 €
2 414 €
2 386 €
2 303 €

Least expensive cities

City
name
Ascending orderHouses
house
Price per m²
584 €
646 €
690 €
706 €
708 €
710 €
717 €
732 €
City
name
Ascending orderApartments
apt.
Price per m²
143 €
154 €
159 €
191 €
204 €
218 €
227 €