emooki
HomePrice mapTransactions
🇬🇧 English🇫🇷 Français🇩🇪 Deutsch🇪🇸 Español🇮🇹 Italiano

Real estate price map


Real estate price map in the municipality of Montagny-près-Louhans, choose a section to see transactions by parcel.

Saône-et-Loire (71)
Montagny-près-Louhans

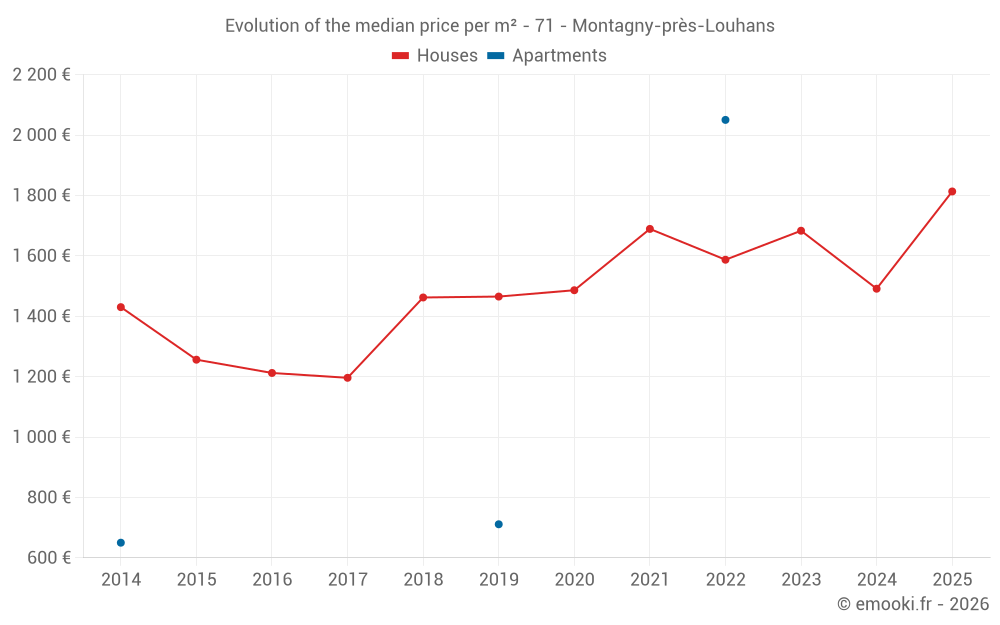
Median price of real estate
in the municipality of Montagny-près-Louhans

HousesHouses
1 658  /m²
1-23-45-67-89-10
Reliability 6/10
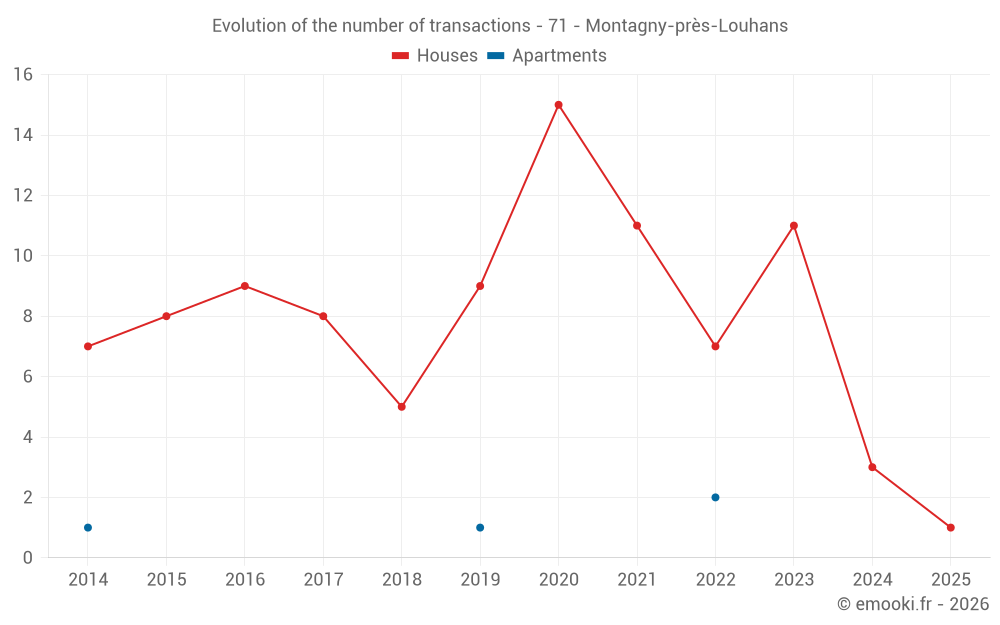
Median price on the 18 transactions of the last 36 months.
from 1 358 to
2 214  /m²
60% of transactions from the 2nd to the 8th deciles.
ApartmentsApartments
750  /m²
1-23-45-67-89-10
Reliability 1/10
Median price on the 3 transactions of the last 120 months.
DwellingsDwellings
1 658  /m²
1-23-45-67-89-10
Reliability 6/10
Median price on the 20 transactions of the last 36 months.
from 1 300 to
2 294  /m²
60% of transactions from the 2nd to the 8th deciles.

Yearly evolution

Evolution of the median price per m²

Evolution of the number of transactions

Warning, last year incomplete. Projections made based on the proportions between semesters of the previous year at the departmental/national level and by type of property.

Yearly data

Descending order
Year
Houses
house
transactions
Houses
house
Price per m²
Apartments
apt.
transactions
Apartments
apt.
Price per m²
2025
1
1 813 
0
--- 
2024
3
1 491 
0
--- 
2023
11
1 683 
0
--- 
2022
7
1 587 
2
2 050 
2021
11
1 689 
0
--- 
2020
15
1 486 
0
--- 
2019
9
1 465 
1
711 
2018
5
1 462 
0
--- 
2017
8
1 196 
0
--- 
2016
9
1 212 
0
--- 
2015
8
1 256 
0
--- 
2014
7
1 430 
1
650 

Analysis

Structure of prices per m²

Values of price percentiles per m² over the periods used for the estimated price of each type of property.

Structure of transaction amounts

Values of transaction amounts percentiles over the periods used for the estimated price of each type of property.

Transaction amounts and prices per m² by percentile

Ascending order
Percentile
Houses
house
Price per m²
Houses
house
Transaction amount
Apartments
apt.
Price per m²
Apartments
apt.
Transaction amount
10th percentile
1 204 
95 500 
719 
69 600 
20th percentile
1 358 
126 K
727 
79 200 
30th percentile
1 493 
131 K
734 
88 800 
40th percentile
1 573 
139 K
742 
98 400 
50th percentile
1 658 
158 K
750 
108 K
60th percentile
1 749 
171 K
1 270 
153 K
70th percentile
1 967 
197 K
1 790 
199 K
80th percentile
2 214 
233 K
2 310 
244 K
90th percentile
2 606 
246 K
2 830 
290 K

National and departmental comparison

Evolution of the median price per m² of houses

Evolution of the median price per m² of apartments

Quarterly evolution

Evolution of the median price per m²

Evolution of the number of transactions

Quarterly data

Descending order
Quarter
Houses
house
transactions
Houses
house
Price per m²
Apartments
apt.
transactions
Apartments
apt.
Price per m²
2025 Q1
1
1 813 
0
--- 
2024 Q3
1
2 292 
0
--- 
2024 Q2
2
1 467 
0
--- 
2023 Q4
4
1 682 
0
--- 
2023 Q3
3
3 310 
0
--- 
2023 Q2
2
981 
0
--- 
2023 Q1
2
1 487 
0
--- 
2022 Q4
3
1 587 
0
--- 
2022 Q3
0
--- 
2
2 050 
2022 Q2
2
1 536 
0
--- 
2022 Q1
2
1 551 
0
--- 
2021 Q4
3
934 
0
--- 
2021 Q3
2
1 676 
0
--- 
2021 Q2
3
1 689 
0
--- 
2021 Q1
3
1 979 
0
--- 
2020 Q4
5
1 642 
0
--- 
2020 Q3
3
469 
0
--- 
2020 Q2
3
1 639 
0
--- 
2020 Q1
4
1 436 
0
--- 
2019 Q4
3
880 
0
--- 
2019 Q3
0
--- 
1
711 
2019 Q2
2
1 664 
0
--- 
2019 Q1
4
1 411 
0
--- 
2018 Q4
1
1 284 
0
--- 
2018 Q2
1
1 811 
0
--- 
2018 Q1
3
1 462 
0
--- 
2017 Q4
4
1 196 
0
--- 
2017 Q3
1
1 317 
0
--- 
2017 Q2
2
482 
0
--- 
2017 Q1
1
1 505 
0
--- 
2016 Q4
6
1 052 
0
--- 
2016 Q3
1
1 060 
0
--- 
2016 Q1
2
1 665 
0
--- 
2015 Q4
4
1 588 
0
--- 
2015 Q3
3
1 180 
0
--- 
2015 Q2
1
920 
0
--- 
2014 Q4
4
1 435 
0
--- 
2014 Q3
1
1 449 
0
--- 
2014 Q2
2
1 156 
0
--- 
2014 Q1
0
--- 
1
650 

Overview of the latest real estate transactions

The following list is an anonymized overview of the latest transactions. For more details and to find all transactions, please use the map to view transactions by plot or the transaction search page for a search by criteria.

2025-05-06
7 000 
Sale
Land
8440 m2
-Taillis sous futaie
2025-03-10
34 000 
Sale
Land
684 m2
-Prés
Land
1776 m2
-Prés
2025-03-06
136 000 
1 813  /m²(75 m²)
Sale
Houses
House
1 room
75 m2
1 outbuilding
Land
2289 m2
-Sols
Land
336 m2
-Vignes
Land
140 m2
-Prés
Land
23 m2
-Terres
Land
11 m2
-Terres
Land
2321 m2
-Terres
Land
3 m2
-Sols
Land
1440 m2
-Terrains à bâtir
Land
58 m2
-Prés
Land
4626 m2
-Prés
Land
48 m2
-Prés
Land
2781 m2
-Prés
2025-02-05
800 
Sale
Land
3990 m2
-Taillis sous futaie
2024-08-02
32 000 
Sale
Land
3102 m2
-Prés
2024-07-29
100 
Sale
Land
517 m2
-Eaux
2024-07-24
2 500 
Sale
Land
3207 m2
-Taillis sous futaie
2024-07-12
165 000 
2 292  /m²(72 m²)
Sale
Houses
House
3 rooms
72 m2
Land
1000 m2
-Sols
Land
2080 m2
-Prés
2024-06-27
140 000 
1 443  /m²(97 m²)
Sale
Houses
House
3 rooms
97 m2
Land
1607 m2
-Sols
Land
21 m2
-Sols
Land
1100 m2
-Prés
2024-05-31
85 000 
1 491  /m²(57 m²)
Sale
Houses
House
2 rooms
57 m2
Land
4106 m2
-Sols
2024-05-17
3 000 
Sale
Land
6640 m2
-Terres
Land
3700 m2
-Terres
2024-03-20
1 000 
Sale
Land
1427 m2
-Taillis simples
Land
685 m2
-Taillis sous futaie
2024-02-12
1 000 
Sale
Land
2184 m2
-Taillis sous futaie
2024-01-22
19 340 
Sale
Land
1125 m2
-Terres
Land
340 m2
-Terres
2023-12-22
174 000 
2 096  /m²(83 m²)
Sale
Houses
House
4 rooms
83 m2
Land
915 m2
-Sols
Land
66 m2
-Sols
Land
214 m2
-Sols
Land
1429 m2
-Prés
2023-12-16
236 600 
1 632  /m²(145 m²)
Sale
Houses
House
4 rooms
145 m2
1 outbuilding
Land
1113 m2
-Sols
Land
3056 m2
-Prés
Land
500 m2
-Sols
Land
1000 m2
-Terrains d'agrément
2023-12-12
354 
Sale
Land
2360 m2
-Prés
2023-12-07
125 000 
1 302  /m²(96 m²)
Sale
Houses
House
4 rooms
96 m2
1 outbuilding
Land
1235 m2
-Sols
Land
1070 m2
-Jardins
/Jardin potager
2023-11-21
1 450 
Sale
Land
8528 m2
-Terres
2023-10-13
130 000 
1 733  /m²(75 m²)
Sale
Houses
House
1 room
75 m2
1 outbuilding
Land
2289 m2
-Sols
Land
336 m2
-Vignes
Land
140 m2
-Prés
Land
23 m2
-Terres
Land
11 m2
-Terres
Land
2321 m2
-Terres
Land
3 m2
-Sols
Land
1440 m2
-Terrains à bâtir
Land
58 m2
-Prés
Land
4626 m2
-Prés
Land
48 m2
-Prés
Land
2781 m2
-Prés
210 transactions listed in the municipality

Saône-et-Loire (71)

Most expensive cities

City
name
Descending orderHouses
house
Price per m²
2 677 
2 667 
2 604 
2 570 
2 554 
2 508 
City
name
Descending orderApartments
apt.
Price per m²
6 368 
5 118 
3 333 
3 131 
2 806 
2 450 
2 303 

Least expensive cities

City
name
Ascending orderHouses
house
Price per m²
646 
690 
706 
708 
710 
City
name
Ascending orderApartments
apt.
Price per m²
154 
159 
191 
218