emooki
HomePrice mapTransactions
🇬🇧 English🇫🇷 Français🇩🇪 Deutsch🇪🇸 Español🇮🇹 Italiano

Real estate price map


Real estate price map in the municipality of Châtenoy-le-Royal.

Saône-et-Loire (71)
Châtenoy-le-Royal

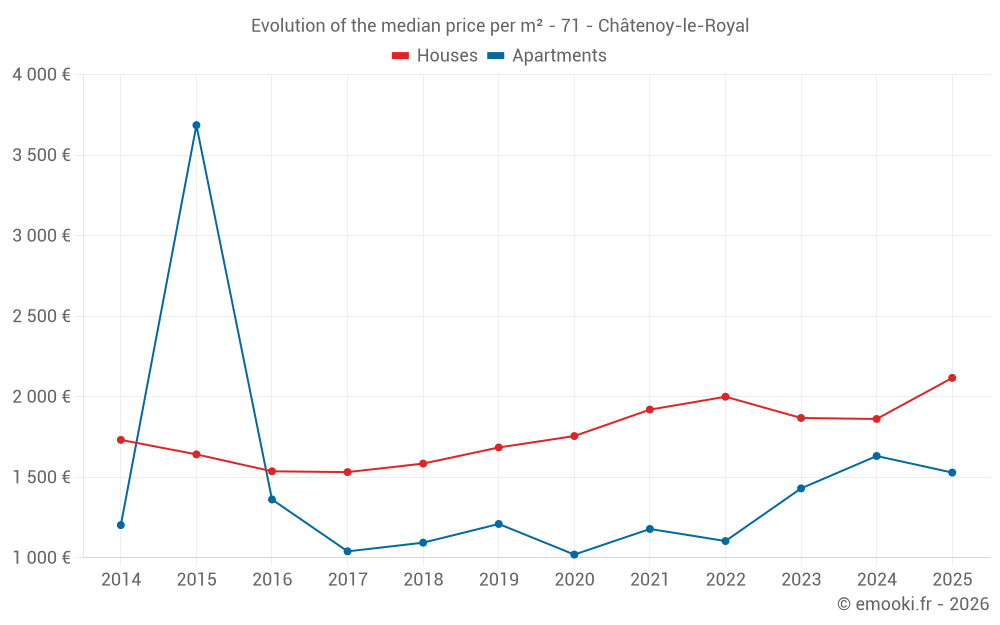
Median price of real estate
in the municipality of Châtenoy-le-Royal

HousesHouses
2 117  /m²
1-23-45-67-89-10
Reliability 9/10
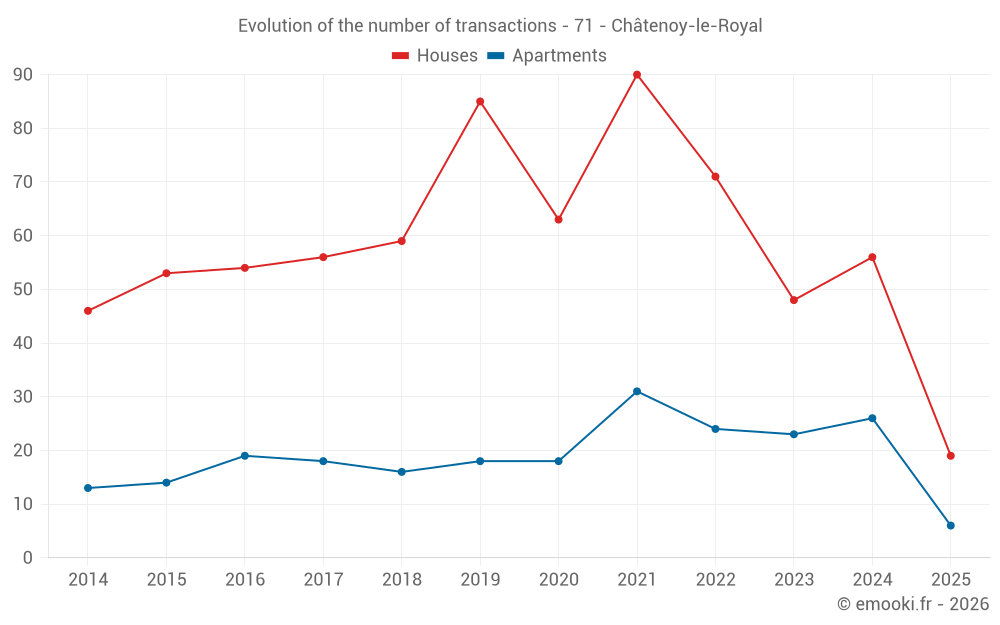
Median price on the 19 transactions of the last 6 months.
from 1 599 to
2 532  /m²
60% of transactions from the 2nd to the 8th deciles.
ApartmentsApartments
1 667  /m²
1-23-45-67-89-10
Reliability 8/10
Median price on the 23 transactions of the last 12 months.
from 1 338 to
2 668  /m²
60% of transactions from the 2nd to the 8th deciles.
DwellingsDwellings
1 910  /m²
1-23-45-67-89-10
Reliability 9/10
Median price on the 25 transactions of the last 6 months.
from 1 458 to
2 494  /m²
60% of transactions from the 2nd to the 8th deciles.
HousesEvolution of the price per m² of houses since...
1 year
+14%
2 years
+13%
3 years
+5.9%
4 years
+10%
5 years
+21%
6 years
+26%
7 years
+34%
8 years
+38%
9 years
+38%
10 years
+29%
11 years
+22%
ApartmentsEvolution of the price per m² of apartments since...
1 year
-6.3%
2 years
+6.8%
3 years
+38%
4 years
+30%
5 years
+50%
6 years
+26%
7 years
+40%
8 years
+47%
9 years
+12%
10 years
-59%
11 years
+27%

Yearly evolution

Evolution of the median price per m²

Evolution of the number of transactions

Warning, last year incomplete. Projections made based on the proportions between semesters of the previous year at the departmental/national level and by type of property.

Yearly data

Descending order
Year
Houses
house
transactions
Houses
house
Price per m²
Apartments
apt.
transactions
Apartments
apt.
Price per m²
2025
19
2 117 
6
1 529 
2024
56
1 862 
26
1 632 
2023
48
1 868 
23
1 431 
2022
71
2 000 
24
1 104 
2021
90
1 920 
31
1 179 
2020
63
1 756 
18
1 020 
2019
85
1 685 
18
1 210 
2018
59
1 585 
16
1 094 
2017
56
1 532 
18
1 040 
2016
54
1 537 
19
1 362 
2015
53
1 642 
14
3 686 
2014
46
1 732 
13
1 203 

Analysis

Structure of prices per m²

Values of price percentiles per m² over the periods used for the estimated price of each type of property.

Structure of transaction amounts

Values of transaction amounts percentiles over the periods used for the estimated price of each type of property.

Transaction amounts and prices per m² by percentile

Ascending order
Percentile
Houses
house
Price per m²
Houses
house
Transaction amount
Apartments
apt.
Price per m²
Apartments
apt.
Transaction amount
10th percentile
1 396 
134 K
947 
52 049 
20th percentile
1 599 
145 K
1 338 
61 400 
30th percentile
1 903 
154 K
1 455 
79 600 
40th percentile
2 021 
168 K
1 586 
89 200 
50th percentile
2 117 
180 K
1 667 
102 K
60th percentile
2 322 
195 K
1 720 
118 K
70th percentile
2 440 
218 K
1 828 
121 K
80th percentile
2 532 
227 K
2 668 
124 K
90th percentile
2 761 
236 K
3 012 
152 K

National and departmental comparison

Evolution of the median price per m² of houses

Evolution of the median price per m² of apartments

Quarterly evolution

Evolution of the median price per m²

Evolution of the number of transactions

Quarterly data

Descending order
Quarter
Houses
house
transactions
Houses
house
Price per m²
Apartments
apt.
transactions
Apartments
apt.
Price per m²
2025 Q2
13
2 221 
4
1 388 
2025 Q1
6
2 008 
2
1 774 
2024 Q4
13
1 828 
11
1 810 
2024 Q3
29
1 906 
6
1 679 
2024 Q2
11
2 051 
6
1 362 
2024 Q1
3
1 773 
3
1 248 
2023 Q4
11
1 720 
3
1 431 
2023 Q3
15
1 949 
5
1 067 
2023 Q2
10
1 688 
6
1 454 
2023 Q1
12
2 008 
9
1 521 
2022 Q4
16
2 262 
4
1 148 
2022 Q3
12
2 088 
10
1 208 
2022 Q2
21
1 977 
5
1 229 
2022 Q1
22
1 954 
5
889 
2021 Q4
25
2 027 
6
969 
2021 Q3
22
1 916 
9
1 179 
2021 Q2
25
1 929 
10
1 938 
2021 Q1
18
1 764 
6
1 098 
2020 Q4
20
1 861 
3
1 357 
2020 Q3
14
1 916 
2
1 236 
2020 Q2
18
1 771 
9
923 
2020 Q1
11
1 663 
4
1 294 
2019 Q4
21
1 625 
2
2 253 
2019 Q3
23
1 685 
10
1 193 
2019 Q2
26
1 732 
3
1 339 
2019 Q1
15
1 625 
3
1 200 
2018 Q4
13
1 646 
5
1 271 
2018 Q3
24
1 675 
3
711 
2018 Q2
14
1 498 
5
1 100 
2018 Q1
8
1 430 
3
913 
2017 Q4
15
1 570 
6
922 
2017 Q3
18
1 512 
2
814 
2017 Q2
14
1 602 
8
2 726 
2017 Q1
9
1 379 
2
2 900 
2016 Q4
9
1 677 
1
771 
2016 Q3
15
1 552 
5
1 469 
2016 Q2
17
1 369 
9
1 418 
2016 Q1
13
1 445 
4
1 064 
2015 Q4
20
1 644 
1
3 557 
2015 Q3
15
1 620 
5
1 293 
2015 Q2
12
1 575 
6
2 546 
2015 Q1
6
1 606 
2
4 146 
2014 Q4
13
1 714 
7
1 298 
2014 Q3
16
1 682 
4
921 
2014 Q2
6
1 703 
2
1 189 
2014 Q1
11
1 863 
0
--- 

Saône-et-Loire (71)

Most expensive cities

City
name
Descending orderHouses
house
Price per m²
2 677 
2 667 
2 604 
2 570 
2 554 
2 508 
City
name
Descending orderApartments
apt.
Price per m²
6 368 
5 118 
3 333 
3 131 
2 806 
2 450 
2 303 

Least expensive cities

City
name
Ascending orderHouses
house
Price per m²
646 
690 
706 
708 
710 
City
name
Ascending orderApartments
apt.
Price per m²
154 
159 
191 
218