Real estate price map
Real estate price map in the municipality of Vy-lès-Rupt, choose a section to see transactions by parcel.
Haute-Saône (70)
Price per m² in Vy-lès-Rupt
Median price of real estate
in the municipality of Vy-lès-Rupt
Houses
779 € /m²
Reliability 4/10
Median price on the 9 transactions of the last 60 months.
Apartments
1 367 € /m²
Reliability 1/10
Price of the unique transaction of the last 120 months.
Dwellings
779 € /m²
Reliability 4/10
Median price on the 9 transactions of the last 60 months.
Yearly evolution
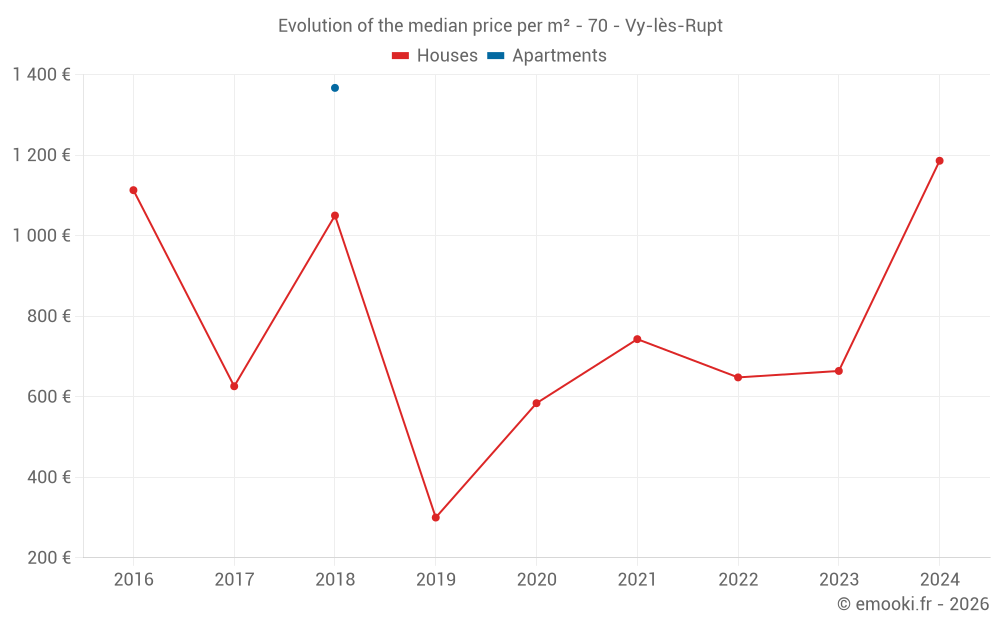
Evolution of the median price per m²
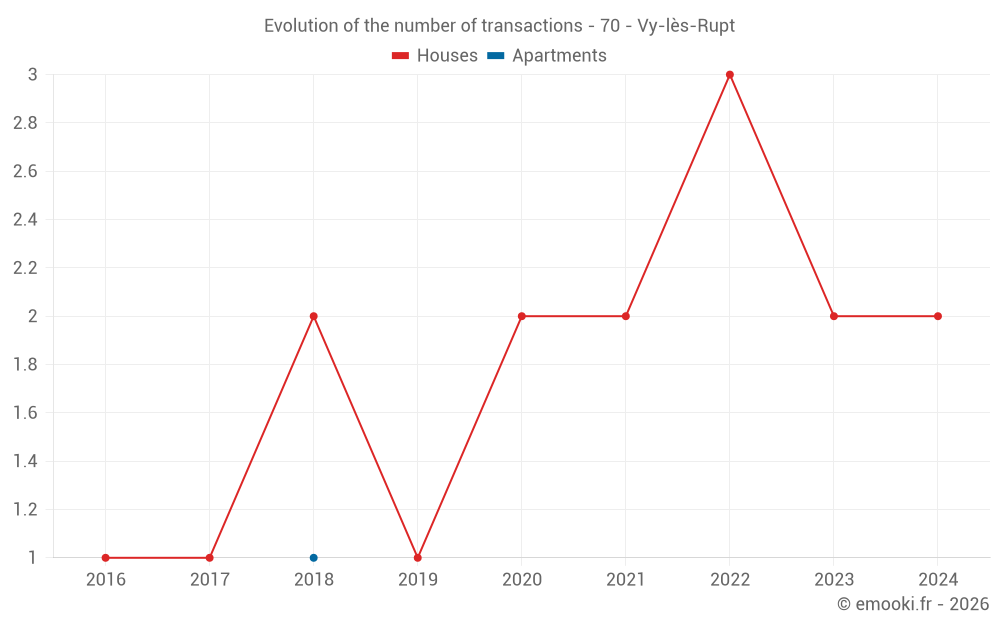
Evolution of the number of transactions
Warning, last year incomplete. Projections made based on the proportions between semesters of the previous year at the departmental/national level and by type of property.
Yearly data
Year
house
transactions
transactions
house
Price per m²
Price per m²
apt.
transactions
transactions
apt.
Price per m²
Price per m²
2025
0
--- €
0
--- €
2024
2
1 186 €
0
--- €
2023
2
664 €
0
--- €
2022
3
648 €
0
--- €
2021
2
743 €
0
--- €
2020
2
584 €
0
--- €
2019
1
300 €
0
--- €
2018
2
1 050 €
1
1 367 €
2017
1
626 €
0
--- €
2016
1
1 113 €
0
--- €
2015
0
--- €
0
--- €
2014
0
--- €
0
--- €
Analysis
Structure of prices per m²
Values of price percentiles per m² over the periods used for the estimated price of each type of property.
Structure of transaction amounts
Values of transaction amounts percentiles over the periods used for the estimated price of each type of property.
Transaction amounts and prices per m² by percentile
Percentile
house
Price per m²
Price per m²
house
Transaction amount
Transaction amount
apt.
Price per m²
Price per m²
apt.
Transaction amount
Transaction amount
10th percentile
522 €
44 000 €
1 367 €
365 K€
20th percentile
600 €
48 700 €
1 367 €
365 K€
30th percentile
672 €
72 700 €
1 367 €
365 K€
40th percentile
721 €
110 K€
1 367 €
365 K€
50th percentile
779 €
118 K€
1 367 €
365 K€
60th percentile
817 €
128 K€
1 367 €
365 K€
70th percentile
931 €
134 K€
1 367 €
365 K€
80th percentile
1 019 €
161 K€
1 367 €
365 K€
90th percentile
1 112 €
202 K€
1 367 €
365 K€
National and departmental comparison
Evolution of the median price per m² of houses
Evolution of the median price per m² of apartments
Quarterly evolution
Evolution of the median price per m²
Evolution of the number of transactions
Quarterly data
Quarter
house
transactions
transactions
house
Price per m²
Price per m²
apt.
transactions
transactions
apt.
Price per m²
Price per m²
2024 Q2
1
1 000 €
0
--- €
2024 Q1
1
1 372 €
0
--- €
2023 Q3
1
827 €
0
--- €
2023 Q1
1
500 €
0
--- €
2022 Q3
1
648 €
0
--- €
2022 Q1
2
788 €
0
--- €
2021 Q2
1
707 €
0
--- €
2021 Q1
1
779 €
0
--- €
2020 Q1
2
584 €
0
--- €
2019 Q3
1
300 €
0
--- €
2018 Q4
0
--- €
1
1 367 €
2018 Q2
2
1 050 €
0
--- €
2017 Q2
1
626 €
0
--- €
2016 Q4
1
1 113 €
0
--- €
Overview of the latest real estate transactions
The following list is an anonymized overview of the latest transactions. For more details and to find all transactions, please use the map to view transactions by plot or the transaction search page for a search by criteria.
2025-03-12
8 000 €Sale
Land
5358 m2
-Futaies résineuses
/Sapins ou sapinière
Land
5357 m2
-Taillis simples
2024-12-18
8 500 €Sale
Land
6362 m2
-Futaies résineuses
/Sapins ou sapinière
Land
6924 m2
-Taillis simples
Land
244 m2
-Sols
Land
22000 m2
-Terres
2024-12-03
1 680 €Sale
Land
1863 m2
-Terres
Land
3727 m2
-Terres
2024-11-19
475 €Sale
Land
2267 m2
-Futaies résineuses
/Sapins ou sapinière
2024-08-23
7 000 €Sale
Land
393 m2
-Sols
2024-06-06
130 000 €1 000 € /m²(130 m²)
Sale
House
6 rooms
130 m2
Land
1390 m2
-Sols
Land
735 m2
-Jardins
Land
2573 m2
-Terres
2024-03-22
500 €Sale
Land
180 m2
-Prés
2024-03-22
118 000 €1 372 € /m²(86 m²)
Sale
House
4 rooms
86 m2
Land
532 m2
-Sols
Land
13 m2
-Sols
2024-03-07
7 021 €Sale
Land
1003 m2
-Prés
2024-03-07
7 021 €Sale
Land
910 m2
-Prés
Land
93 m2
-Prés
2023-11-14
1 500 €Sale
Land
3470 m2
-Taillis simples
2023-11-06
450 €Sale
Land
934 m2
-Prés
2023-08-04
107 500 €827 € /m²(130 m²)
Sale
House
5 rooms
130 m2
Land
790 m2
-Sols
Land
942 m2
-Prés
Land
405 m2
-Jardins
Land
19 m2
-Prés
2023-03-23
30 000 €500 € /m²(60 m²)
Sale
House
2 rooms
60 m2
Land
335 m2
-Sols
Land
350 m2
-Jardins
Land
2771 m2
-Prés
Land
564 m2
-Prés
2022-12-13
900 €Sale
Land
1990 m2
-Taillis simples
2022-09-21
10 000 €Sale
Land
2985 m2
-Prés
Land
11335 m2
-Prés
2022-08-05
199 000 €648 € /m²(307 m²)
Sale
House
6 rooms
160 m2
Land
385 m2
-Sols
House
5 rooms
147 m2
Land
786 m2
-Sols
Land
413 m2
-Jardins
Land
6013 m2
-Prés
Land
36 m2
-Sols
2022-03-09
214 700 €1 047 € /m²(205 m²)
Sale
House
6 rooms
205 m2
Land
1307 m2
-Sols
Land
1235 m2
-Vergers
Land
475 m2
-Jardins
2022-03-02
47 500 €528 € /m²(90 m²)
Sale
House
4 rooms
90 m2
Land
87 m2
-Sols
Land
41 m2
-Sols
2022-01-13
31 900 €Sale
Land
3154 m2
-Prés
Land
5218 m2
-Prés
Land
17735 m2
-Prés
Land
406 m2
-Sols
Land
54762 m2
-Prés
Land
27381 m2
-Prés
Land
2115 m2
-Prés
48 transactions listed in the municipality
Compare with neighboring municipalities
City
name
name
house
Price per m²
Price per m²
apt.
Price per m²
Price per m²
City information
Zip code
- 70120 VY LES RUPT
Data source & update
- Latest publication of the property value request (DVF) database made available by the DGFiP on October 19, 2025, covering transactions up to 06/30/2025:
- Administrative/cadastral division as of September 1, 2025, and municipal movements as of January 1, 2025: