Real estate price map
Real estate price map in the municipality of Vyans-le-Val, choose a section to see transactions by parcel.
Haute-Saône (70)
Price per m² in Vyans-le-Val
Median price of real estate
in the municipality of Vyans-le-Val
Houses
1 592 € /m²
Reliability 6/10
Median price on the 13 transactions of the last 36 months.
from 1 284 to
1 976 € /m²
1 976 € /m²
60% of transactions from the 2nd to the 8th deciles.
Apartments
1 053 € /m²
Reliability 1/10
Price of the unique transaction of the last 120 months.
Dwellings
1 592 € /m²
Reliability 6/10
Median price on the 13 transactions of the last 36 months.
from 1 284 to
1 976 € /m²
1 976 € /m²
60% of transactions from the 2nd to the 8th deciles.
Yearly evolution
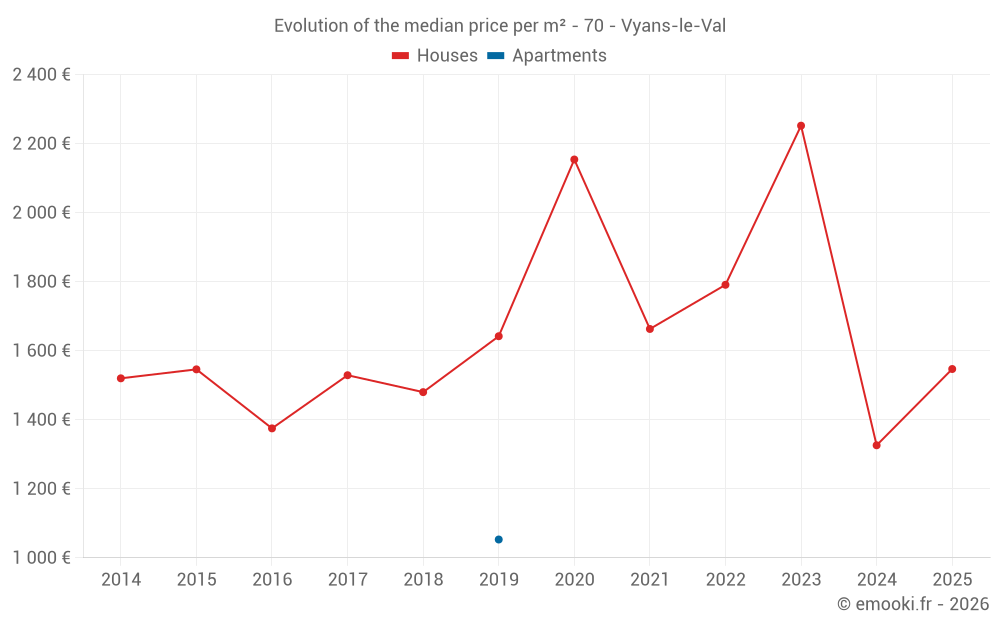
Evolution of the median price per m²
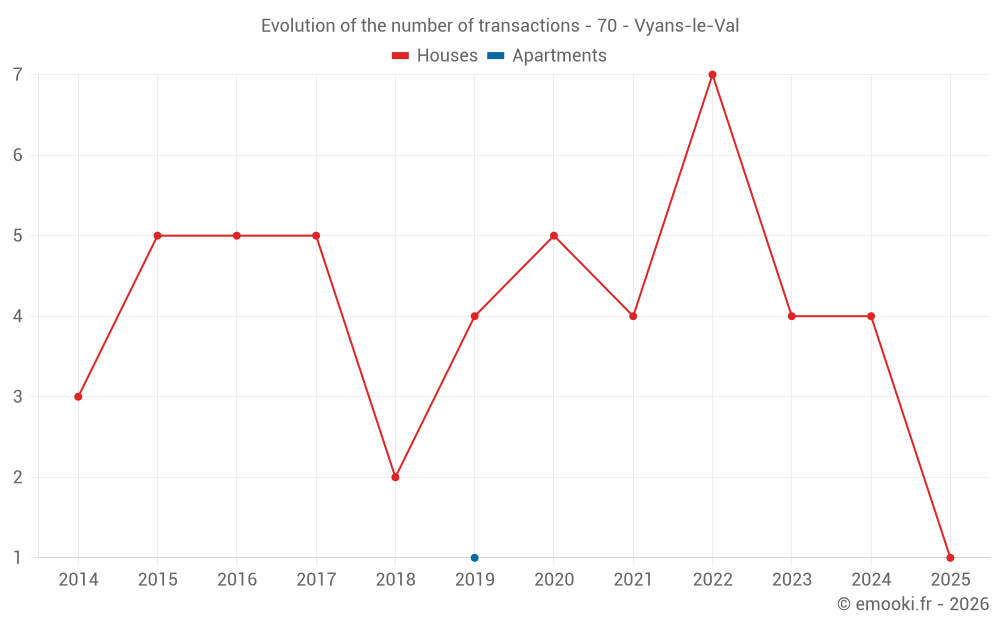
Evolution of the number of transactions
Warning, last year incomplete. Projections made based on the proportions between semesters of the previous year at the departmental/national level and by type of property.
Yearly data
Year
house
transactions
transactions
house
Price per m²
Price per m²
apt.
transactions
transactions
apt.
Price per m²
Price per m²
2025
1
1 547 €
0
--- €
2024
4
1 326 €
0
--- €
2023
4
2 252 €
0
--- €
2022
7
1 791 €
0
--- €
2021
4
1 663 €
0
--- €
2020
5
2 154 €
0
--- €
2019
4
1 642 €
1
1 053 €
2018
2
1 480 €
0
--- €
2017
5
1 529 €
0
--- €
2016
5
1 375 €
0
--- €
2015
5
1 546 €
0
--- €
2014
3
1 520 €
0
--- €
Analysis
Structure of prices per m²
Values of price percentiles per m² over the periods used for the estimated price of each type of property.
Structure of transaction amounts
Values of transaction amounts percentiles over the periods used for the estimated price of each type of property.
Transaction amounts and prices per m² by percentile
Percentile
house
Price per m²
Price per m²
house
Transaction amount
Transaction amount
apt.
Price per m²
Price per m²
apt.
Transaction amount
Transaction amount
10th percentile
1 170 €
109 K€
1 053 €
80 000 €
20th percentile
1 284 €
143 K€
1 053 €
80 000 €
30th percentile
1 396 €
182 K€
1 053 €
80 000 €
40th percentile
1 522 €
187 K€
1 053 €
80 000 €
50th percentile
1 592 €
190 K€
1 053 €
80 000 €
60th percentile
1 814 €
212 K€
1 053 €
80 000 €
70th percentile
1 909 €
229 K€
1 053 €
80 000 €
80th percentile
1 976 €
252 K€
1 053 €
80 000 €
90th percentile
2 391 €
273 K€
1 053 €
80 000 €
National and departmental comparison
Evolution of the median price per m² of houses
Evolution of the median price per m² of apartments
Quarterly evolution
Evolution of the median price per m²
Evolution of the number of transactions
Quarterly data
Quarter
house
transactions
transactions
house
Price per m²
Price per m²
apt.
transactions
transactions
apt.
Price per m²
Price per m²
2025 Q2
1
1 547 €
0
--- €
2024 Q4
1
1 420 €
0
--- €
2024 Q1
3
1 233 €
0
--- €
2023 Q4
1
2 019 €
0
--- €
2023 Q3
1
2 493 €
0
--- €
2023 Q2
2
1 922 €
0
--- €
2022 Q4
2
1 394 €
0
--- €
2022 Q3
2
1 692 €
0
--- €
2022 Q2
2
2 180 €
0
--- €
2022 Q1
1
1 338 €
0
--- €
2021 Q4
2
1 648 €
0
--- €
2021 Q3
2
1 966 €
0
--- €
2020 Q4
2
2 428 €
0
--- €
2020 Q3
1
2 154 €
0
--- €
2020 Q1
2
1 206 €
0
--- €
2019 Q4
1
1 308 €
0
--- €
2019 Q3
3
1 770 €
0
--- €
2019 Q1
0
--- €
1
1 053 €
2018 Q4
1
1 842 €
0
--- €
2018 Q1
1
1 117 €
0
--- €
2017 Q4
2
1 414 €
0
--- €
2017 Q3
2
1 346 €
0
--- €
2017 Q1
1
1 629 €
0
--- €
2016 Q4
3
1 375 €
0
--- €
2016 Q2
2
1 336 €
0
--- €
2015 Q4
2
1 706 €
0
--- €
2015 Q3
2
1 733 €
0
--- €
2015 Q1
1
1 371 €
0
--- €
2014 Q4
2
1 913 €
0
--- €
2014 Q2
1
625 €
0
--- €
Overview of the latest real estate transactions
The following list is an anonymized overview of the latest transactions. For more details and to find all transactions, please use the map to view transactions by plot or the transaction search page for a search by criteria.
2025-06-04
225 900 €1 547 € /m²(146 m²)
Sale
House
8 rooms
146 m2
Land
4162 m2
-Jardins
Land
500 m2
-Sols
2025-04-04
1 300 €Sale
Land
1305 m2
-Prés
2025-01-17
1 300 €Sale
Land
253 m2
-Vergers
Land
1000 m2
-Prés
2024-10-31
8 324 €Sale
Land
778 m2
-Prés
2024-10-31
2 621 €Sale
Land
245 m2
-Prés
2024-10-23
208 800 €1 420 € /m²(147 m²)
Sale
House
5 rooms
147 m2
1 outbuilding
Land
500 m2
-Sols
Land
1541 m2
-Jardins
2024-09-20
2 500 €Sale
Land
1844 m2
-Prés
2024-05-13
1 €Sale
Land
684 m2
-Prés
Land
70 m2
-Prés
2024-04-19
5 000 €Sale
Land
1640 m2
-Terres
2024-03-29
106 000 €1 233 € /m²(86 m²)
Sale
House
3 rooms
86 m2
Land
312 m2
-Sols
Land
262 m2
-Jardins
Land
40 m2
-Jardins
Land
345 m2
-Vergers
2024-03-28
80 000 €Sale
Land
326 m2
-Prés
Land
53 m2
-Prés
Land
336 m2
-Prés
Land
366 m2
-Prés
Land
9 m2
-Sols
Land
92 m2
-Sols
Land
181 m2
-Sols
Land
5 m2
-Sols
2024-03-15
187 400 €1 912 € /m²(98 m²)
Sale
House
5 rooms
98 m2
2 outbuildings
Land
500 m2
-Sols
Land
1210 m2
-Jardins
2024-03-01
105 000 €1 154 € /m²(91 m²)
Sale
House
5 rooms
91 m2
Land
386 m2
-Sols
2023-12-29
2 500 €Sale
Land
4700 m2
-Terres
2023-12-19
88 000 €Sale
Land
53 m2
-Prés
Land
366 m2
-Prés
Land
92 m2
-Sols
Land
700 m2
-Prés
Land
181 m2
-Sols
Land
5 m2
-Sols
2023-12-19
40 000 €Sale
Land
344 m2
-Prés
Land
173 m2
-Prés
Land
83 m2
-Prés
2023-11-24
264 500 €2 019 € /m²(131 m²)
Sale
House
5 rooms
131 m2
2 outbuildings
Land
500 m2
-Sols
Land
572 m2
-Jardins
Land
37 m2
-Terres
Land
339 m2
-Taillis simples
2023-08-31
2 500 €Sale
Land
1844 m2
-Prés
2023-08-31
448 800 €2 493 € /m²(180 m²)
Sale
House
6 rooms
180 m2
Land
1340 m2
-Sols
Land
21 m2
-Sols
2023-07-20
450 €Sale
Land
53 m2
-Prés
Land
366 m2
-Prés
Land
92 m2
-Sols
Land
181 m2
-Sols
Land
5 m2
-Sols
85 transactions listed in the municipality
Compare with neighboring municipalities
City
name
name
house
Price per m²
Price per m²
apt.
Price per m²
Price per m²
City information
Zip code
- 70400 VYANS LE VAL
Data source & update
- Latest publication of the property value request (DVF) database made available by the DGFiP on October 19, 2025, covering transactions up to 06/30/2025:
- Administrative/cadastral division as of September 1, 2025, and municipal movements as of January 1, 2025: