Real estate price map
Real estate price map in the municipality of Jasney, choose a section to see transactions by parcel.
Haute-Saône (70)
Price per m² in Jasney
Median price of real estate
in the municipality of Jasney
Houses
494 € /m²
Reliability 4/10
Median price on the 10 transactions of the last 60 months.
Yearly evolution
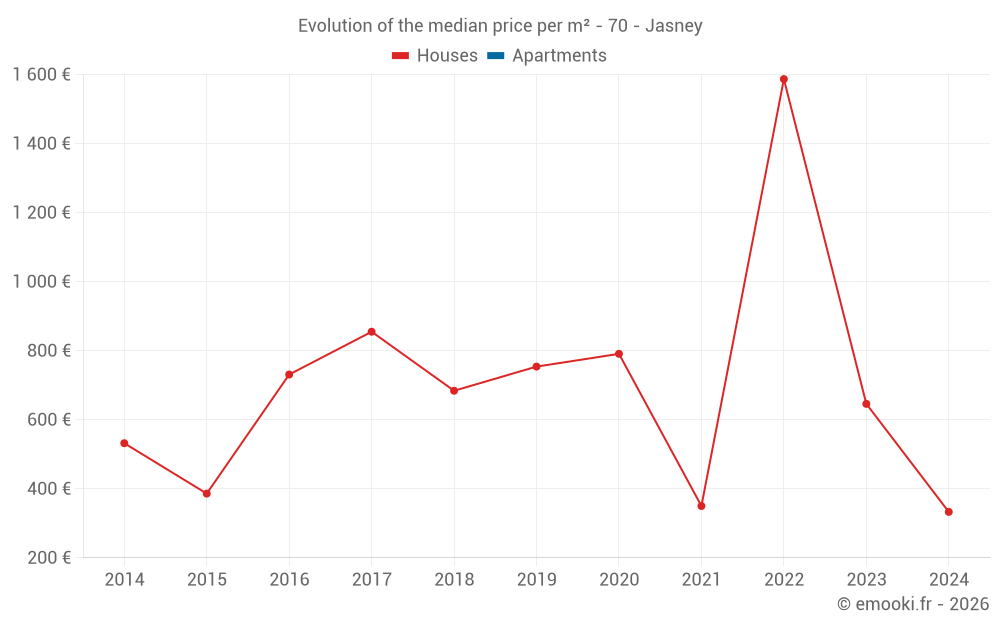
Evolution of the median price per m²
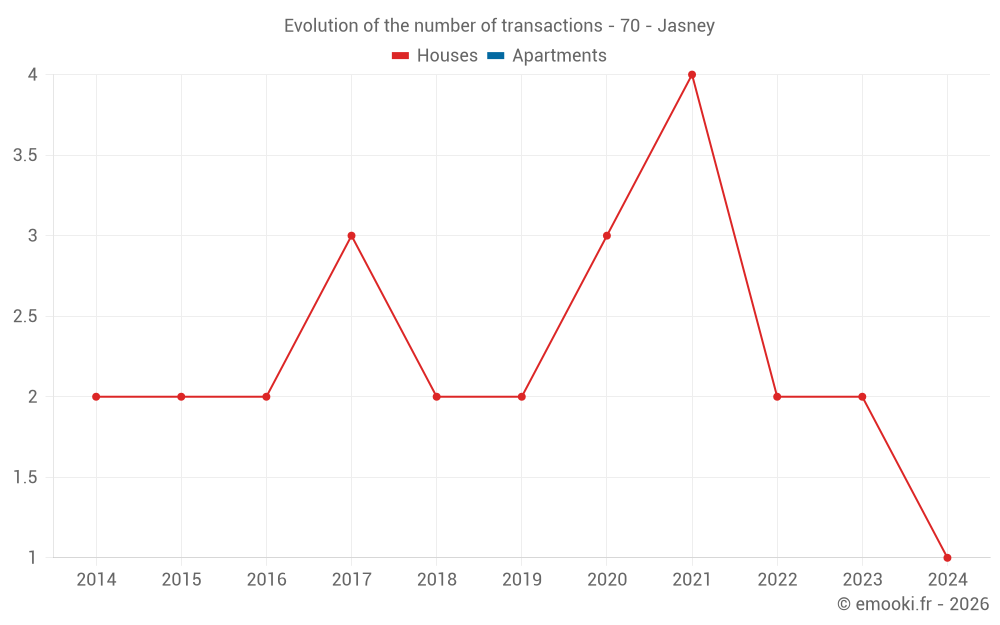
Evolution of the number of transactions
Warning, last year incomplete. Projections made based on the proportions between semesters of the previous year at the departmental/national level and by type of property.
Yearly data
Year
house
transactions
transactions
house
Price per m²
Price per m²
apt.
transactions
transactions
apt.
Price per m²
Price per m²
2025
0
--- €
0
--- €
2024
1
333 €
0
--- €
2023
2
646 €
0
--- €
2022
2
1 587 €
0
--- €
2021
4
350 €
0
--- €
2020
3
791 €
0
--- €
2019
2
754 €
0
--- €
2018
2
684 €
0
--- €
2017
3
855 €
0
--- €
2016
2
731 €
0
--- €
2015
2
386 €
0
--- €
2014
2
532 €
0
--- €
Analysis
Structure of prices per m²
Values of price percentiles per m² over the periods used for the estimated price of each type of property.
Structure of transaction amounts
Values of transaction amounts percentiles over the periods used for the estimated price of each type of property.
Transaction amounts and prices per m² by percentile
Percentile
house
Price per m²
Price per m²
house
Transaction amount
Transaction amount
apt.
Price per m²
Price per m²
apt.
Transaction amount
Transaction amount
10th percentile
192 €
18 800 €
--- €
--- €
20th percentile
293 €
28 000 €
--- €
--- €
30th percentile
328 €
33 500 €
--- €
--- €
40th percentile
426 €
38 000 €
--- €
--- €
50th percentile
494 €
44 000 €
--- €
--- €
60th percentile
690 €
68 000 €
--- €
--- €
70th percentile
996 €
98 750 €
--- €
--- €
80th percentile
1 102 €
115 K€
--- €
--- €
90th percentile
1 419 €
171 K€
--- €
--- €
National and departmental comparison
Evolution of the median price per m² of houses
Evolution of the median price per m² of apartments
Quarterly evolution
Evolution of the median price per m²
Evolution of the number of transactions
Quarterly data
Quarter
house
transactions
transactions
house
Price per m²
Price per m²
apt.
transactions
transactions
apt.
Price per m²
Price per m²
2024 Q2
1
333 €
0
--- €
2023 Q3
1
976 €
0
--- €
2023 Q1
1
316 €
0
--- €
2022 Q4
1
1 043 €
0
--- €
2022 Q3
1
2 131 €
0
--- €
2021 Q3
4
350 €
0
--- €
2020 Q4
1
488 €
0
--- €
2020 Q2
1
791 €
0
--- €
2020 Q1
1
1 375 €
0
--- €
2019 Q3
1
919 €
0
--- €
2019 Q1
1
589 €
0
--- €
2018 Q3
2
684 €
0
--- €
2017 Q3
1
214 €
0
--- €
2017 Q2
1
1 259 €
0
--- €
2017 Q1
1
855 €
0
--- €
2016 Q4
1
362 €
0
--- €
2016 Q2
1
1 100 €
0
--- €
2015 Q3
1
393 €
0
--- €
2015 Q1
1
378 €
0
--- €
2014 Q4
1
944 €
0
--- €
2014 Q1
1
119 €
0
--- €
Overview of the latest real estate transactions
The following list is an anonymized overview of the latest transactions. For more details and to find all transactions, please use the map to view transactions by plot or the transaction search page for a search by criteria.
2025-04-25
2 800 €Sale
Land
580 m2
-Prés
2024-09-25
4 330 €Sale
Land
1292 m2
-Prés
Land
514 m2
-Taillis simples
Land
4565 m2
-Taillis simples
Land
1310 m2
-Terres
Land
124 m2
-Terres
Land
956 m2
-Vergers
Land
2000 m2
-Terres
Land
390 m2
-Terres
Land
420 m2
-Terres
Land
2980 m2
-Terres
Land
2760 m2
-Terres
2024-09-06
5 000 €Sale
1 outbuilding
Land
696 m2
-Sols
2024-08-23
10 350 €Sale
Land
1035 m2
-Prés
2024-08-06
50 000 €Sale
Land
2647 m2
-Taillis simples
Land
10332 m2
-Terres
Land
6888 m2
-Terres
Land
9347 m2
-Terres
Land
37385 m2
-Terres
Land
6280 m2
-Taillis simples
Land
15283 m2
-Terres
Land
61133 m2
-Terres
Land
4840 m2
-Vergers
Land
6960 m2
-Taillis simples
2024-07-11
2 000 €Sale
Land
9177 m2
-Prés
2024-07-09
10 000 €Sale
Land
1030 m2
-Prés
2024-07-09
7 900 €Sale
Land
790 m2
-Prés
2024-05-10
20 000 €333 € /m²(60 m²)
Sale
House
3 rooms
60 m2
Land
1199 m2
-Sols
2024-04-30
110 000 €367 € /m²(300 m²)
Sale
Commercial property
300 m2
Land
1251 m2
-Terres
Land
1500 m2
-Sols
2023-10-03
600 €Sale
Land
662 m2
-Prés
Land
2 m2
-Sols
2023-08-31
175 750 €976 € /m²(180 m²)
Sale
House
6 rooms
180 m2
Land
608 m2
-Sols
Land
959 m2
-Prés
2023-04-19
708 €Sale
Land
2830 m2
-Landes
/Friche
2023-04-06
5 294 €Sale
Land
3040 m2
-Taillis simples
Land
520 m2
-Prés
Land
8808 m2
-Terres
Land
8807 m2
-Terres
2023-03-27
5 500 €Sale
Land
9175 m2
-Taillis simples
Land
9696 m2
-Taillis sous futaie
Land
1522 m2
-Terres
Land
3927 m2
-Taillis simples
2023-01-20
48 000 €316 € /m²(152 m²)
Sale
House
4 rooms
152 m2
Land
158 m2
-Sols
Land
77 m2
-Sols
Land
106 m2
-Sols
2022-12-29
2 400 €Sale
Land
9890 m2
-Terres
Land
2473 m2
-Terres
2022-12-12
98 000 €1 043 € /m²(94 m²)
Sale
House
4 rooms
94 m2
Land
991 m2
-Sols
2022-07-21
170 500 €2 131 € /m²(80 m²)
Sale
House
3 rooms
80 m2
Land
77 m2
-Sols
Land
47 m2
-Sols
Land
105 m2
-Sols
Land
78 m2
-Sols
Land
61 m2
-Sols
Land
117 m2
-Jardins
Land
561 m2
-Jardins
Land
283 m2
-Jardins
2021-11-02
500 €Sale
Land
2963 m2
-Taillis simples
70 transactions listed in the municipality
Compare with neighboring municipalities
City
name
name
house
Price per m²
Price per m²
apt.
Price per m²
Price per m²
City information
Zip code
- 70800 JASNEY
Data source & update
- Latest publication of the property value request (DVF) database made available by the DGFiP on October 19, 2025, covering transactions up to 06/30/2025:
- Administrative/cadastral division as of September 1, 2025, and municipal movements as of January 1, 2025: