Real estate price map
Real estate price map in the municipality of Frédéric-Fontaine, choose a section to see transactions by parcel.
Haute-Saône (70)
Price per m² in Frédéric-Fontaine
Median price of real estate
in the municipality of Frédéric-Fontaine
Houses
1 065 € /m²
Reliability 5/10
Median price on the 11 transactions of the last 48 months.
from 621 to
1 571 € /m²
1 571 € /m²
60% of transactions from the 2nd to the 8th deciles.
Apartments
701 € /m²
Reliability 1/10
Price of the unique transaction of the last 120 months.
Dwellings
1 040 € /m²
Reliability 5/10
Median price on the 12 transactions of the last 48 months.
from 637 to
1 556 € /m²
1 556 € /m²
60% of transactions from the 2nd to the 8th deciles.
Yearly evolution
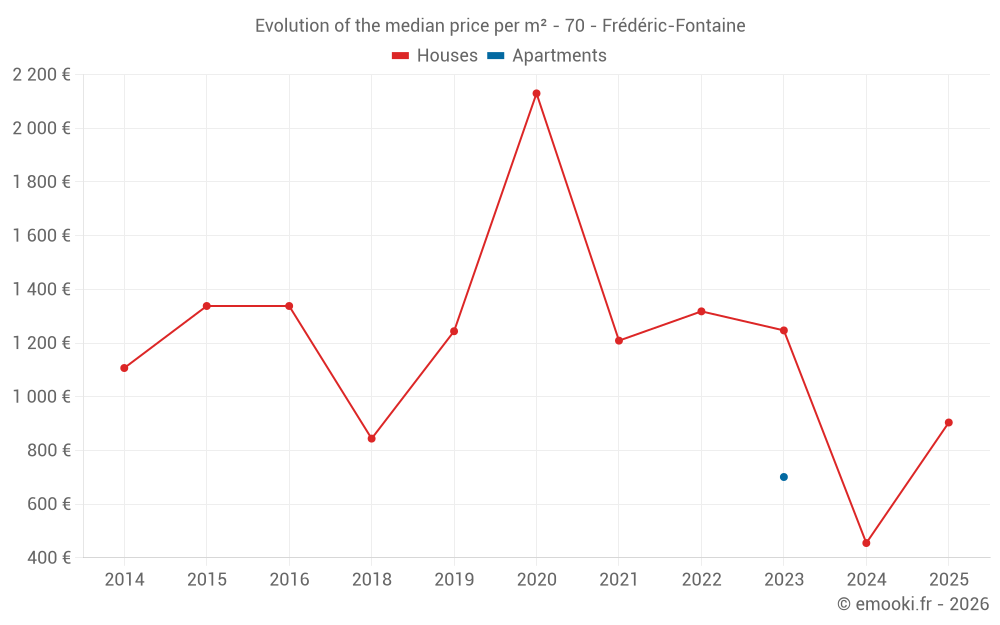
Evolution of the median price per m²
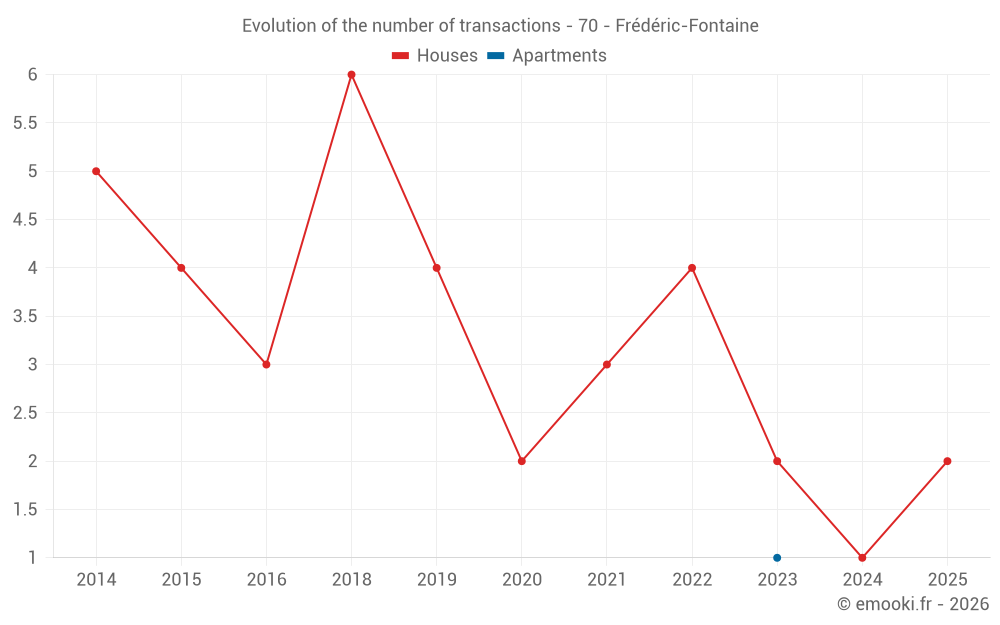
Evolution of the number of transactions
Warning, last year incomplete. Projections made based on the proportions between semesters of the previous year at the departmental/national level and by type of property.
Yearly data
Year
house
transactions
transactions
house
Price per m²
Price per m²
apt.
transactions
transactions
apt.
Price per m²
Price per m²
2025
2
904 €
0
--- €
2024
1
455 €
0
--- €
2023
2
1 247 €
1
701 €
2022
4
1 318 €
0
--- €
2021
3
1 209 €
0
--- €
2020
2
2 130 €
0
--- €
2019
4
1 244 €
0
--- €
2018
6
844 €
0
--- €
2017
0
--- €
0
--- €
2016
3
1 338 €
0
--- €
2015
4
1 338 €
0
--- €
2014
5
1 107 €
0
--- €
Analysis
Structure of prices per m²
Values of price percentiles per m² over the periods used for the estimated price of each type of property.
Structure of transaction amounts
Values of transaction amounts percentiles over the periods used for the estimated price of each type of property.
Transaction amounts and prices per m² by percentile
Percentile
house
Price per m²
Price per m²
house
Transaction amount
Transaction amount
apt.
Price per m²
Price per m²
apt.
Transaction amount
Transaction amount
10th percentile
581 €
50 000 €
701 €
115 K€
20th percentile
621 €
82 000 €
701 €
115 K€
30th percentile
999 €
84 000 €
701 €
115 K€
40th percentile
1 015 €
101 K€
701 €
115 K€
50th percentile
1 065 €
114 K€
701 €
115 K€
60th percentile
1 188 €
123 K€
701 €
115 K€
70th percentile
1 495 €
133 K€
701 €
115 K€
80th percentile
1 571 €
154 K€
701 €
115 K€
90th percentile
1 867 €
204 K€
701 €
115 K€
National and departmental comparison
Evolution of the median price per m² of houses
Evolution of the median price per m² of apartments
Quarterly evolution
Evolution of the median price per m²
Evolution of the number of transactions
Quarterly data
Quarter
house
transactions
transactions
house
Price per m²
Price per m²
apt.
transactions
transactions
apt.
Price per m²
Price per m²
2025 Q1
2
904 €
0
--- €
2024 Q3
1
455 €
0
--- €
2023 Q3
1
999 €
1
701 €
2023 Q1
1
1 495 €
0
--- €
2022 Q4
3
1 065 €
0
--- €
2022 Q1
1
1 571 €
0
--- €
2021 Q4
2
1 441 €
0
--- €
2021 Q1
1
1 209 €
0
--- €
2020 Q3
1
1 661 €
0
--- €
2020 Q1
1
2 600 €
0
--- €
2019 Q2
1
1 382 €
0
--- €
2019 Q1
3
1 106 €
0
--- €
2018 Q4
1
196 €
0
--- €
2018 Q3
2
472 €
0
--- €
2018 Q2
3
1 167 €
0
--- €
2016 Q4
1
1 338 €
0
--- €
2016 Q3
1
1 089 €
0
--- €
2016 Q2
1
1 744 €
0
--- €
2015 Q4
3
1 136 €
0
--- €
2015 Q2
1
2 581 €
0
--- €
2014 Q3
3
926 €
0
--- €
2014 Q2
2
1 220 €
0
--- €
Overview of the latest real estate transactions
The following list is an anonymized overview of the latest transactions. For more details and to find all transactions, please use the map to view transactions by plot or the transaction search page for a search by criteria.
2025-05-16
516 €Sale
Land
1720 m2
-Terres
2025-03-31
3 435 €Sale
Land
770 m2
-Terres
Land
2080 m2
-Prés
Land
1300 m2
-Prés
Land
802 m2
-Prés
Land
2890 m2
-Prés
Land
1745 m2
-Prés
Land
1126 m2
-Prés
Land
1235 m2
-Prés
Land
1020 m2
-Prés
Land
880 m2
-Prés
Land
1145 m2
-Terres
2025-03-05
3 000 €Sale
Land
631 m2
-Vergers
2025-02-26
206 €Sale
Land
1030 m2
-Prés
2025-02-26
199 €Sale
Land
316 m2
-Sols
Land
670 m2
-Prés
Land
10 m2
-Sols
2025-02-19
82 000 €621 € /m²(132 m²)
Sale
House
5 rooms
132 m2
2 outbuildings
Land
313 m2
-Sols
Land
324 m2
-Sols
Land
523 m2
-Sols
Land
59 m2
-Sols
Land
829 m2
-Vergers
Land
103 m2
-Sols
2025-02-13
4 015 €Sale
Land
1522 m2
-Prés
Land
1085 m2
-Terres
Land
1085 m2
-Prés
Land
285 m2
-Prés
Land
59 m2
-Prés
Land
232 m2
-Prés
Land
470 m2
-Prés
Land
700 m2
-Prés
Land
435 m2
-Prés
Land
300 m2
-Terres
Land
1020 m2
-Terres
Land
800 m2
-Taillis simples
Land
800 m2
-Landes
/Friche
Land
365 m2
-Terres
Land
1305 m2
-Prés
Land
1420 m2
-Prés
Land
1500 m2
-Terres
2025-02-06
1 823 €Sale
Land
590 m2
-Prés
Land
2855 m2
-Terres
Land
659 m2
-Terres
Land
933 m2
-Prés
Land
1422 m2
-Prés
Land
932 m2
-Prés
2025-01-20
237 500 €1 188 € /m²(200 m²)
Sale
House
6 rooms
200 m2
1 outbuilding
Land
333 m2
-Jardins
Land
1000 m2
-Sols
Land
415 m2
-Taillis simples
Land
390 m2
-Taillis simples
Land
116 m2
-Terres
Land
367 m2
-Prés
Land
153 m2
-Prés
Land
223 m2
-Terres
Land
545 m2
-Terres
2024-07-10
40 000 €455 € /m²(88 m²)
Sale
House
2 rooms
88 m2
Land
230 m2
-Sols
Land
160 m2
-Vergers
2024-04-30
5 000 €Sale
Land
1067 m2
-Vergers
Land
198 m2
-Vergers
Land
348 m2
-Vergers
2024-02-12
35 000 €Sale
Land
680 m2
-Vergers
Land
358 m2
-Vergers
2023-11-06
2 000 €Sale
Land
260 m2
-Vergers
Land
51 m2
-Sols
2023-07-28
115 000 €701 € /m²(164 m²)
Sale
Apartment
3 rooms
82 m2
Apartment
4 rooms
82 m2
1 outbuilding
Land
320 m2
-Sols
Land
339 m2
-Jardins
2023-07-04
122 900 €999 € /m²(123 m²)
Sale
House
5 rooms
123 m2
Land
261 m2
-Sols
Land
35 m2
-Jardins
2023-06-15
799 €Sale
Land
1419 m2
-Eaux
Land
1202 m2
-Prés
Land
600 m2
-Prés
Land
252 m2
-Prés
Land
243 m2
-Prés
Land
345 m2
-Eaux
Land
200 m2
-Prés
Land
640 m2
-Eaux
Land
425 m2
-Prés
Land
1270 m2
-Eaux
Land
355 m2
-Prés
Land
500 m2
-Eaux
Land
300 m2
-Prés
Land
383 m2
-Eaux
Land
558 m2
-Eaux
Land
1399 m2
-Prés
Land
196 m2
-Prés
Land
363 m2
-Eaux
2023-03-31
133 050 €1 495 € /m²(89 m²)
Sale
House
4 rooms
89 m2
2 outbuildings
Land
500 m2
-Jardins
Land
500 m2
-Sols
2023-01-11
3 230 €Sale
Land
190 m2
-Prés
2023-01-11
4 505 €Sale
Land
146 m2
-Prés
Land
14 m2
-Sols
Land
105 m2
-Prés
2022-12-23
114 000 €1 065 € /m²(107 m²)
Sale
House
3 rooms
107 m2
Land
158 m2
-Sols
1 outbuilding
Land
21 m2
-Sols
104 transactions listed in the municipality
Compare with neighboring municipalities
City
name
name
house
Price per m²
Price per m²
apt.
Price per m²
Price per m²
City information
Zip code
- 70200 FREDERIC FONTAINE
Data source & update
- Latest publication of the property value request (DVF) database made available by the DGFiP on October 19, 2025, covering transactions up to 06/30/2025:
- Administrative/cadastral division as of September 1, 2025, and municipal movements as of January 1, 2025: