Real estate price map
Real estate price map in the municipality of Dambenoît-lès-Colombe, choose a section to see transactions by parcel.
Haute-Saône (70)
Price per m² in Dambenoît-lès-Colombe
Median price of real estate
in the municipality of Dambenoît-lès-Colombe
Houses
1 440 € /m²
Reliability 3/10
Median price on the 8 transactions of the last 72 months.
Apartments
686 € /m²
Reliability 1/10
Median price on the 4 transactions of the last 120 months.
Dwellings
1 152 € /m²
Reliability 3/10
Median price on the 10 transactions of the last 72 months.
Yearly evolution
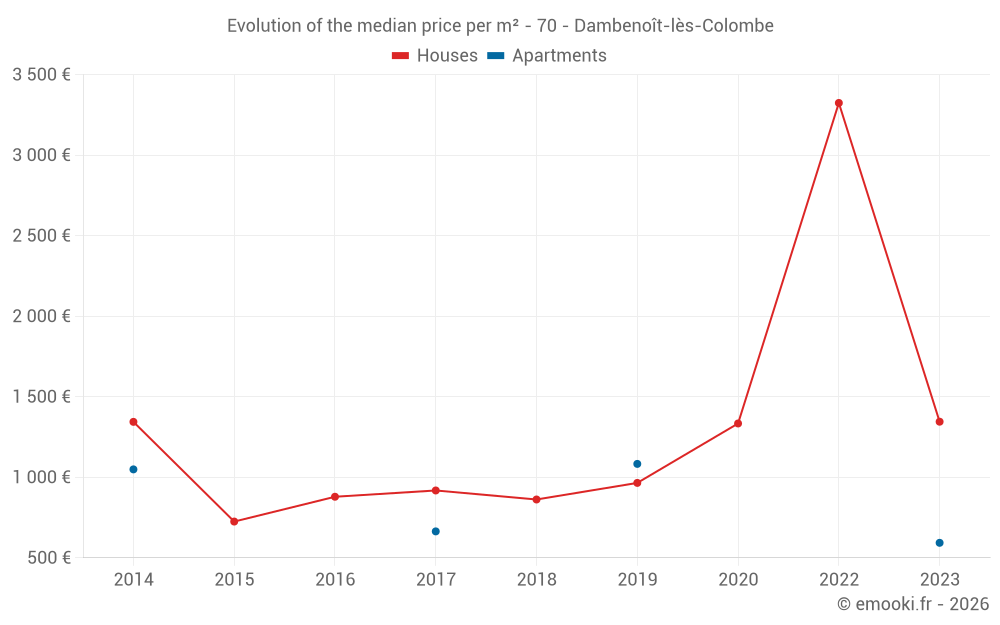
Evolution of the median price per m²
Evolution of the number of transactions
Warning, last year incomplete. Projections made based on the proportions between semesters of the previous year at the departmental/national level and by type of property.
Yearly data
Year
house
transactions
transactions
house
Price per m²
Price per m²
apt.
transactions
transactions
apt.
Price per m²
Price per m²
2025
0
--- €
0
--- €
2024
0
--- €
0
--- €
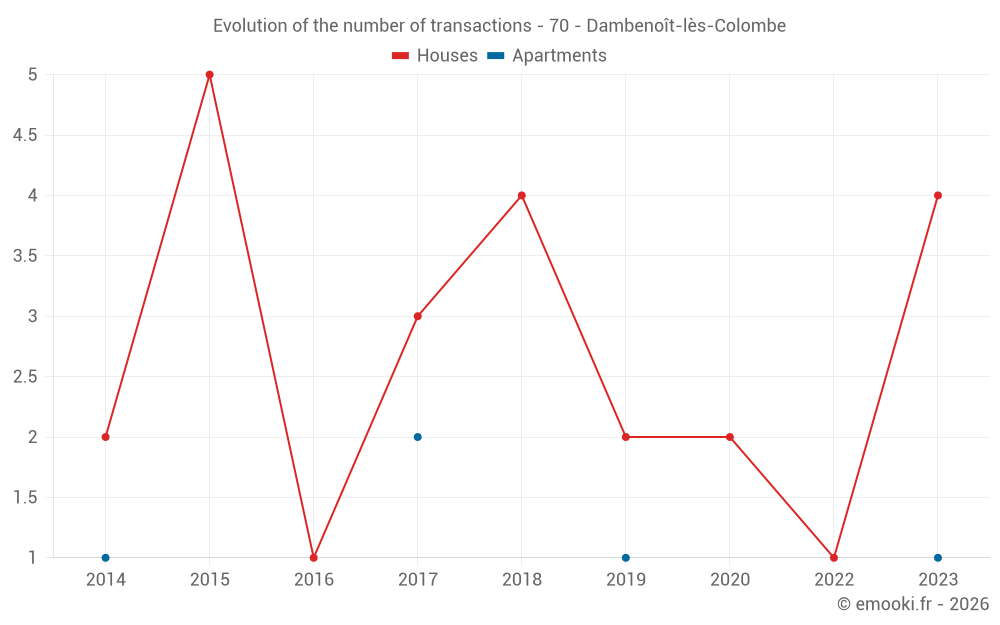
2023
4
1 345 €
1
593 €
2022
1
3 324 €
0
--- €
2021
0
--- €
0
--- €
2020
2
1 334 €
0
--- €
2019
2
965 €
1
1 083 €
2018
4
862 €
0
--- €
2017
3
918 €
2
664 €
2016
1
879 €
0
--- €
2015
5
725 €
0
--- €
2014
2
1 344 €
1
1 049 €
Analysis
Structure of prices per m²
Values of price percentiles per m² over the periods used for the estimated price of each type of property.
Structure of transaction amounts
Values of transaction amounts percentiles over the periods used for the estimated price of each type of property.
Transaction amounts and prices per m² by percentile
Percentile
house
Price per m²
Price per m²
house
Transaction amount
Transaction amount
apt.
Price per m²
Price per m²
apt.
Transaction amount
Transaction amount
10th percentile
851 €
87 390 €
563 €
61 500 €
20th percentile
948 €
97 620 €
576 €
63 000 €
30th percentile
1 049 €
112 K€
589 €
64 500 €
40th percentile
1 183 €
158 K€
630 €
67 400 €
50th percentile
1 440 €
174 K€
686 €
71 000 €
60th percentile
1 683 €
178 K€
741 €
74 600 €
70th percentile
1 764 €
181 K€
808 €
77 600 €
80th percentile
2 404 €
276 K€
900 €
79 400 €
90th percentile
2 973 €
342 K€
992 €
81 200 €
National and departmental comparison
Evolution of the median price per m² of houses
Evolution of the median price per m² of apartments
Quarterly evolution
Evolution of the median price per m²
Evolution of the number of transactions
Quarterly data
Quarter
house
transactions
transactions
house
Price per m²
Price per m²
apt.
transactions
transactions
apt.
Price per m²
Price per m²
2023 Q3
1
750 €
0
--- €
2023 Q2
2
1 345 €
0
--- €
2023 Q1
1
2 823 €
1
593 €
2022 Q3
1
3 324 €
0
--- €
2020 Q4
1
1 775 €
0
--- €
2020 Q2
1
894 €
0
--- €
2019 Q4
1
1 221 €
1
1 083 €
2019 Q1
1
709 €
0
--- €
2018 Q4
1
396 €
0
--- €
2018 Q3
1
1 327 €
0
--- €
2018 Q2
2
1 016 €
0
--- €
2017 Q4
2
1 114 €
0
--- €
2017 Q3
1
806 €
0
--- €
2017 Q2
0
--- €
1
778 €
2017 Q1
0
--- €
1
550 €
2016 Q1
1
879 €
0
--- €
2015 Q4
2
572 €
0
--- €
2015 Q3
1
1 200 €
0
--- €
2015 Q2
2
723 €
0
--- €
2014 Q2
1
1 091 €
1
1 049 €
2014 Q1
1
1 597 €
0
--- €
Overview of the latest real estate transactions
The following list is an anonymized overview of the latest transactions. For more details and to find all transactions, please use the map to view transactions by plot or the transaction search page for a search by criteria.
2025-01-31
1 122 €Sale
Land
490 m2
-Sols
2025-01-13
4 800 €Sale
Land
1420 m2
-Taillis simples
Land
1110 m2
-Taillis simples
Land
1230 m2
-Taillis simples
Land
1240 m2
-Taillis simples
Land
460 m2
-Taillis simples
Land
2340 m2
-Taillis simples
Land
898 m2
-Landes
/Friche
Land
670 m2
-Taillis simples
Land
580 m2
-Taillis simples
Land
465 m2
-Taillis simples
Land
390 m2
-Taillis simples
2024-10-28
1 500 €Sale
Land
300 m2
-Prés
Land
275 m2
-Prés
2024-10-09
2 800 €Sale
Land
3857 m2
-Prés
Land
8256 m2
-Prés
2024-05-21
90 000 €Sale
Land
10880 m2
-Prés
Land
57525 m2
-Terres
Land
3200 m2
-Landes
/Friche
Land
1016 m2
-Landes
/Friche
Land
24756 m2
-Terres
Land
11000 m2
-Prés
Land
22880 m2
-Prés
Land
25978 m2
-Terres
Land
50782 m2
-Prés
Land
112439 m2
-Terres
Land
1480 m2
-Taillis simples
Land
1760 m2
-Taillis simples
Land
4360 m2
-Terres
Land
5609 m2
-Terres
Land
9200 m2
-Prés
Land
25837 m2
-Terres
Land
650 m2
-Landes
Land
480 m2
-Landes
Land
11200 m2
-Prés
Land
40160 m2
-Terres
Land
9606 m2
-Terres
Land
8447 m2
-Terres
Land
1880 m2
-Prés
Land
430 m2
-Prés
Land
1063 m2
-Sols
Land
2448 m2
-Prés
Land
950 m2
-Taillis simples
Land
500 m2
-Taillis simples
Land
990 m2
-Landes
/Friche
Land
788 m2
-Sols
Land
126 m2
-Vergers
2024-04-19
88 €Sale
Land
88 m2
-Prés
2024-03-04
300 €Sale
Land
3342 m2
-Landes
/Friche
Land
560 m2
-Terres
Land
91 m2
-Terres
2023-11-10
300 €Sale
Land
108 m2
-Sols
Land
1180 m2
-Prés
2023-10-27
250 €Exchange
Land
2254 m2
-Landes
/Patis
Land
201 m2
-Prés
2023-08-25
75 000 €750 € /m²(100 m²)
Sale
House
3 rooms
100 m2
Land
810 m2
-Sols
Land
1657 m2
-Vergers
2023-07-28
500 €Sale
Land
369 m2
-Prés
2023-06-20
92 700 €1 030 € /m²(90 m²)
Sale
House
4 rooms
90 m2
Land
102 m2
-Sols
Land
91 m2
-Landes
/Friche
2 outbuildings
Land
913 m2
-Vergers
Land
160 m2
-Sols
2023-06-20
171 000 €1 660 € /m²(103 m²)
Sale
House
4 rooms
103 m2
1 outbuilding
Land
569 m2
-Sols
Land
378 m2
-Vergers
Land
47 m2
-Sols
Land
134 m2
-Sols
2023-05-24
4 000 €Sale
Land
3631 m2
-Prés
Land
1365 m2
-Prés
Land
508 m2
-Prés
Land
1791 m2
-Prés
Land
2030 m2
-Prés
Land
1510 m2
-Prés
Land
2765 m2
-Prés
2023-03-15
300 €Sale
Land
3790 m2
-Vergers
2023-02-22
90 000 €Sale
Land
500 m2
-Sols
Land
548 m2
-Prés
2023-02-10
700 €Sale
Land
1980 m2
-Taillis simples
2023-02-10
83 000 €593 € /m²(140 m²)
Sale
Apartment
4 rooms
100 m2
Apartment
1 room
40 m2
4 outbuildings
Land
822 m2
-Sols
2023-01-21
350 000 €2 823 € /m²(124 m²)
Sale
House
6 rooms
124 m2
Land
9909 m2
-Prés
Land
2356 m2
-Sols
Land
3428 m2
-Prés
Land
4603 m2
-Prés
Land
1110 m2
-Prés
Land
855 m2
-Prés
2022-11-09
35 000 €Sale
Land
45 m2
-Sols
Land
25 m2
-Sols
82 transactions listed in the municipality
Compare with neighboring municipalities
City
name
name
house
Price per m²
Price per m²
apt.
Price per m²
Price per m²
City information
Zip codes
- 70200 DAMBENOIT LES COLOMBE
- COLOMBE LES BITHAINE 70200 DAMBENOIT LES COLOMBE
Data source & update
- Latest publication of the property value request (DVF) database made available by the DGFiP on October 19, 2025, covering transactions up to 06/30/2025:
- Administrative/cadastral division as of September 1, 2025, and municipal movements as of January 1, 2025: