Real estate price map
Real estate price map in the municipality of Bucey-lès-Gy, choose a section to see transactions by parcel.
Haute-Saône (70)
Price per m² in Bucey-lès-Gy
Median price of real estate
in the municipality of Bucey-lès-Gy
Houses
1 059 € /m²
Reliability 6/10
Median price on the 19 transactions of the last 36 months.
from 757 to
1 443 € /m²
1 443 € /m²
60% of transactions from the 2nd to the 8th deciles.
Apartments
530 € /m²
Reliability 1/10
Median price on the 2 transactions of the last 120 months.
Dwellings
1 059 € /m²
Reliability 6/10
Median price on the 19 transactions of the last 36 months.
from 757 to
1 443 € /m²
1 443 € /m²
60% of transactions from the 2nd to the 8th deciles.
Yearly evolution
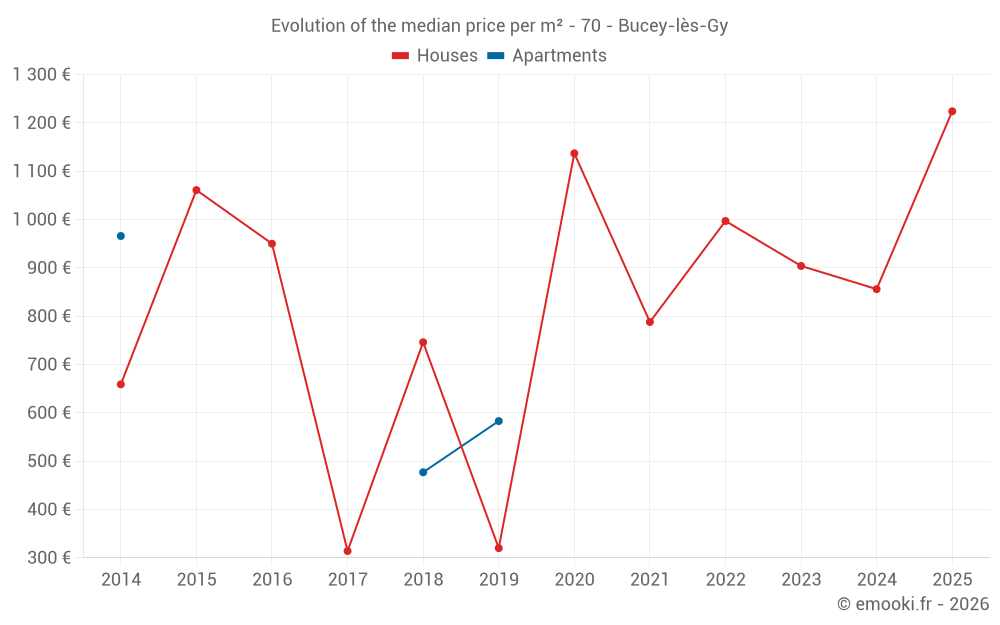
Evolution of the median price per m²
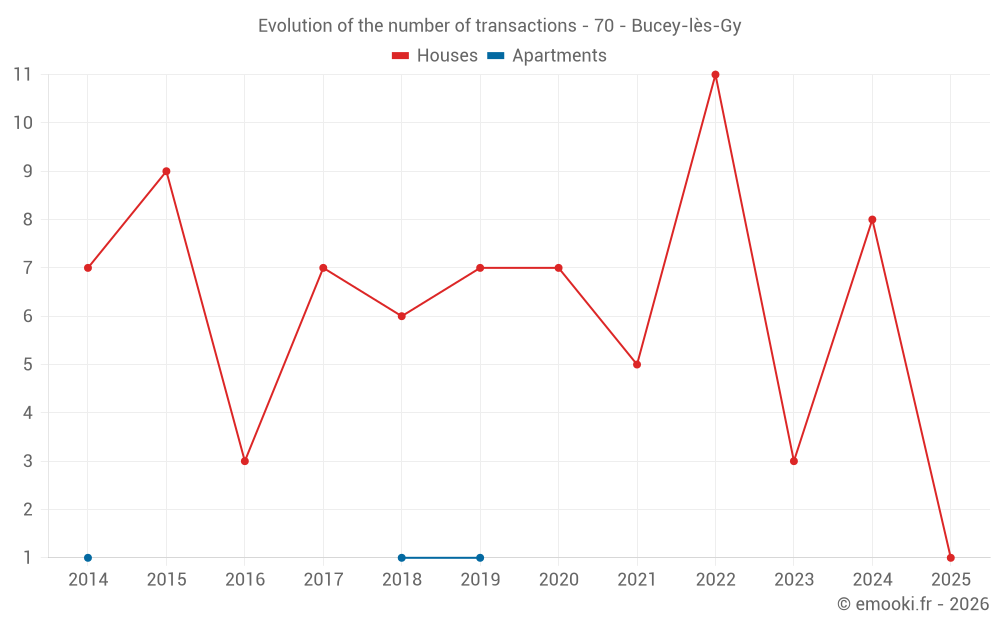
Evolution of the number of transactions
Warning, last year incomplete. Projections made based on the proportions between semesters of the previous year at the departmental/national level and by type of property.
Yearly data
Year
house
transactions
transactions
house
Price per m²
Price per m²
apt.
transactions
transactions
apt.
Price per m²
Price per m²
2025
1
1 224 €
0
--- €
2024
8
856 €
0
--- €
2023
3
904 €
0
--- €
2022
11
997 €
0
--- €
2021
5
788 €
0
--- €
2020
7
1 137 €
0
--- €
2019
7
320 €
1
583 €
2018
6
746 €
1
477 €
2017
7
314 €
0
--- €
2016
3
950 €
0
--- €
2015
9
1 061 €
0
--- €
2014
7
659 €
1
966 €
Analysis
Structure of prices per m²
Values of price percentiles per m² over the periods used for the estimated price of each type of property.
Structure of transaction amounts
Values of transaction amounts percentiles over the periods used for the estimated price of each type of property.
Transaction amounts and prices per m² by percentile
Percentile
house
Price per m²
Price per m²
house
Transaction amount
Transaction amount
apt.
Price per m²
Price per m²
apt.
Transaction amount
Transaction amount
10th percentile
448 €
69 000 €
488 €
99 500 €
20th percentile
757 €
84 200 €
498 €
104 K€
30th percentile
852 €
92 520 €
509 €
109 K€
40th percentile
923 €
104 K€
519 €
113 K€
50th percentile
1 059 €
119 K€
530 €
118 K€
60th percentile
1 342 €
120 K€
541 €
122 K€
70th percentile
1 391 €
125 K€
551 €
127 K€
80th percentile
1 443 €
196 K€
562 €
131 K€
90th percentile
1 638 €
256 K€
572 €
136 K€
National and departmental comparison
Evolution of the median price per m² of houses
Evolution of the median price per m² of apartments
Quarterly evolution
Evolution of the median price per m²
Evolution of the number of transactions
Quarterly data
Quarter
house
transactions
transactions
house
Price per m²
Price per m²
apt.
transactions
transactions
apt.
Price per m²
Price per m²
2025 Q2
1
1 224 €
0
--- €
2024 Q4
3
1 416 €
0
--- €
2024 Q3
3
838 €
0
--- €
2024 Q2
1
1 402 €
0
--- €
2024 Q1
1
452 €
0
--- €
2023 Q3
1
1 372 €
0
--- €
2023 Q2
2
625 €
0
--- €
2022 Q4
5
1 374 €
0
--- €
2022 Q3
2
1 271 €
0
--- €
2022 Q2
1
764 €
0
--- €
2022 Q1
3
759 €
0
--- €
2021 Q4
1
788 €
0
--- €
2021 Q3
2
982 €
0
--- €
2021 Q2
1
596 €
0
--- €
2021 Q1
1
450 €
0
--- €
2020 Q4
1
1 027 €
0
--- €
2020 Q3
4
1 297 €
0
--- €
2020 Q2
1
566 €
0
--- €
2020 Q1
1
1 137 €
0
--- €
2019 Q4
1
257 €
0
--- €
2019 Q3
2
1 148 €
0
--- €
2019 Q2
1
320 €
1
583 €
2019 Q1
3
310 €
0
--- €
2018 Q4
4
725 €
0
--- €
2018 Q3
1
880 €
1
477 €
2018 Q2
1
667 €
0
--- €
2017 Q4
2
794 €
0
--- €
2017 Q3
1
997 €
0
--- €
2017 Q2
4
270 €
0
--- €
2016 Q2
2
925 €
0
--- €
2016 Q1
1
1 155 €
0
--- €
2015 Q4
1
1 139 €
0
--- €
2015 Q3
1
855 €
0
--- €
2015 Q2
4
716 €
0
--- €
2015 Q1
3
1 096 €
0
--- €
2014 Q4
2
784 €
0
--- €
2014 Q3
3
492 €
0
--- €
2014 Q2
0
--- €
1
966 €
2014 Q1
2
1 285 €
0
--- €
Overview of the latest real estate transactions
The following list is an anonymized overview of the latest transactions. For more details and to find all transactions, please use the map to view transactions by plot or the transaction search page for a search by criteria.
2025-05-26
19 305 €Sale
Land
5406 m2
-Terres
Land
13226 m2
-Prés
Land
3058 m2
-Taillis simples
Land
1500 m2
-Vignes
Land
6482 m2
-Landes
/Patis
Land
3388 m2
-Terres
Land
108770 m2
-Landes
/Patis
Land
7600 m2
-Terres
Land
7923 m2
-Prés
Land
7522 m2
-Prés
2025-05-23
18 000 €Sale
Land
51 m2
-Landes
/Patis
Land
147 m2
-Sols
2025-05-09
160 €Sale
Land
262 m2
-Prés
Land
83 m2
-Prés
2025-04-04
120 000 €1 224 € /m²(98 m²)
Sale
House
4 rooms
98 m2
Land
852 m2
-Prés
Land
438 m2
-Sols
2025-01-31
19 050 €Sale
Land
66040 m2
-Taillis simples
Land
40633 m2
-Taillis simples
Land
41649 m2
-Taillis simples
Land
10942 m2
-Taillis simples
2025-01-23
30 000 €Sale
Land
208 m2
-Terres
Land
84 m2
-Sols
Land
72 m2
-Landes
/Patis
Land
259 m2
-Terres
Land
264 m2
-Terres
Land
107 m2
-Terres
Land
204 m2
-Sols
2024-12-20
337 950 €1 594 € /m²(212 m²)
Sale
1 outbuilding
Land
835 m2
-Prés
Land
500 m2
-Sols
House
6 rooms
212 m2
Land
380 m2
-Sols
2024-12-12
12 296 €Sale
Land
3770 m2
-Landes
/Patis
Land
2790 m2
-Landes
/Patis
Land
592 m2
-Landes
/Patis
Land
1202 m2
-Landes
/Patis
Land
1181 m2
-Landes
/Patis
Land
1518 m2
-Landes
/Patis
Land
1455 m2
-Landes
/Patis
Land
3848 m2
-Landes
/Patis
Land
2466 m2
-Landes
/Patis
Land
386 m2
-Landes
/Patis
Land
514 m2
-Landes
/Patis
Land
4329 m2
-Landes
/Patis
Land
6180 m2
-Landes
/Friche
Land
1360 m2
-Taillis simples
Land
1000 m2
-Prés
Land
795 m2
-Taillis simples
Land
795 m2
-Taillis simples
Land
3860 m2
-Landes
/Friche
Land
255 m2
-Landes
/Patis
Land
255 m2
-Landes
/Patis
Land
1855 m2
-Taillis simples
Land
640 m2
-Taillis simples
Land
2020 m2
-Taillis simples
Land
705 m2
-Taillis simples
Land
340 m2
-Taillis simples
Land
830 m2
-Landes
/Patis
Land
1190 m2
-Landes
/Patis
Land
1385 m2
-Landes
/Patis
Land
1670 m2
-Landes
/Patis
2024-11-28
4 734 €Sale
Land
789 m2
-Prés
2024-11-15
110 000 €433 € /m²(254 m²)
Sale
Apartment
2 rooms
40 m2
Apartment
2 rooms
71 m2
Apartment
3 rooms
86 m2
House
3 rooms
57 m2
5 outbuildings
Land
485 m2
-Sols
2024-10-14
177 000 €1 416 € /m²(125 m²)
Sale
House
4 rooms
125 m2
Land
650 m2
-Sols
Land
460 m2
-Prés
Land
900 m2
-Prés
2024-09-27
16 000 €727 € /m²(22 m²)
Exchange
1 outbuilding
Land
275 m2
-Sols
Land
500 m2
-Prés
Commercial property
22 m2
Land
27 m2
-Sols
Land
53 m2
-Jardins
Land
136 m2
-Jardins
Land
373 m2
-Jardins
Land
14 m2
-Sols
Land
27 m2
-Sols
Land
25 m2
-Prés
2024-09-25
16 286 €Sale
Land
970 m2
-Jardins
2024-09-25
9 164 €Sale
Land
519 m2
-Terres
Land
10 m2
-Terres
2024-09-20
500 €Sale
Land
127 m2
-Vergers
Land
4 m2
-Vergers
2024-09-18
1 600 €Sale
Land
885 m2
-Landes
/Patis
Land
4970 m2
-Taillis simples
Land
2020 m2
-Landes
/Patis
2024-08-26
119 000 €838 € /m²(142 m²)
Sale
House
5 rooms
142 m2
Land
144 m2
-Sols
Land
640 m2
-Terres
2024-08-20
4 897 €Sale
Land
7066 m2
-Terres
Land
5252 m2
-Terres
2024-07-10
97 800 €719 € /m²(136 m²)
Sale
House
5 rooms
136 m2
Land
288 m2
-Sols
2024-07-02
119 700 €874 € /m²(137 m²)
Sale
House
6 rooms
137 m2
Land
207 m2
-Sols
194 transactions listed in the municipality
Compare with neighboring municipalities
City
name
name
house
Price per m²
Price per m²
apt.
Price per m²
Price per m²
City information
Zip code
- 70700 BUCEY LES GY
Data source & update
- Latest publication of the property value request (DVF) database made available by the DGFiP on October 19, 2025, covering transactions up to 06/30/2025:
- Administrative/cadastral division as of September 1, 2025, and municipal movements as of January 1, 2025: