emooki
HomePrice mapTransactions
🇬🇧 English🇫🇷 Français🇩🇪 Deutsch🇪🇸 Español🇮🇹 Italiano

Real estate price map


Real estate price map in the municipality of Bouxières-aux-Chênes, choose a section to see transactions by parcel.

Meurthe-et-Moselle (54)
Bouxières-aux-Chênes

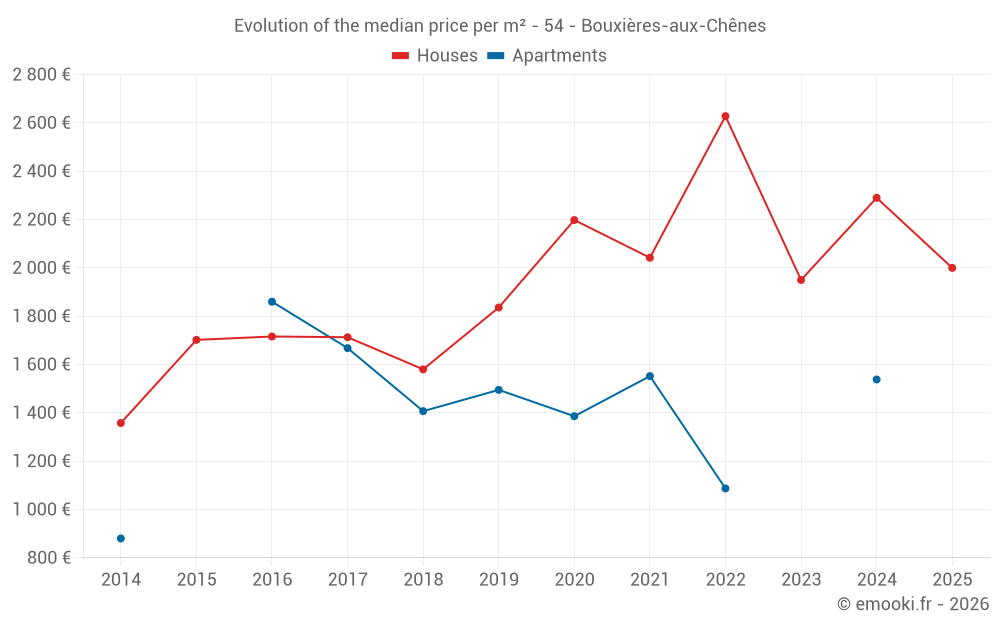
Median price of real estate
in the municipality of Bouxières-aux-Chênes

HousesHouses
2 014  /m²
1-23-45-67-89-10
Reliability 8/10
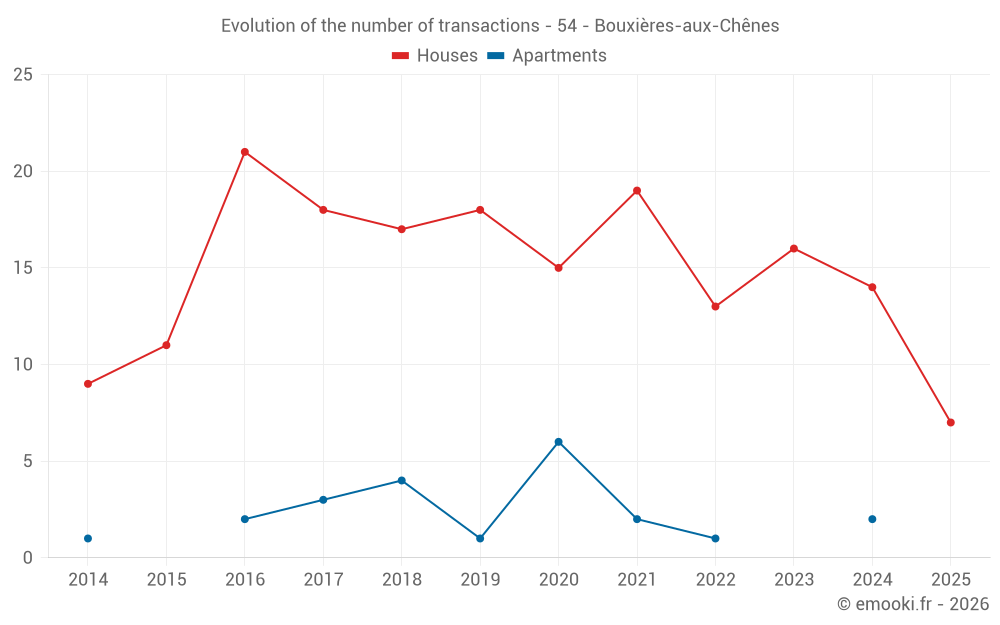
Median price on the 16 transactions of the last 12 months.
from 1 394 to
2 659  /m²
60% of transactions from the 2nd to the 8th deciles.
ApartmentsApartments
1 549  /m²
1-23-45-67-89-10
Reliability 4/10
Median price on the 10 transactions of the last 60 months.
DwellingsDwellings
2 000  /m²
1-23-45-67-89-10
Reliability 8/10
Median price on the 17 transactions of the last 12 months.
from 1 419 to
2 621  /m²
60% of transactions from the 2nd to the 8th deciles.
HousesEvolution of the price per m² of houses since...
1 year
-13%
2 years
+2.6%
3 years
-24%
4 years
-2.1%
5 years
-9%
6 years
+8.9%
7 years
+27%
8 years
+17%
9 years
+17%
10 years
+18%
11 years
+47%
The price per m² of houses has decreased by 24% since 3 years, but it has increased by 47% in 11 years.

Yearly evolution

Evolution of the median price per m²

Evolution of the number of transactions

Warning, last year incomplete. Projections made based on the proportions between semesters of the previous year at the departmental/national level and by type of property.

Yearly data

Descending order
Year
Houses
house
transactions
Houses
house
Price per m²
Apartments
apt.
transactions
Apartments
apt.
Price per m²
2025
7
2 000 
0
--- 
2024
14
2 290 
2
1 538 
2023
16
1 950 
0
--- 
2022
13
2 628 
1
1 087 
2021
19
2 042 
2
1 552 
2020
15
2 198 
6
1 386 
2019
18
1 836 
1
1 495 
2018
17
1 580 
4
1 407 
2017
18
1 713 
3
1 668 
2016
21
1 716 
2
1 860 
2015
11
1 702 
0
--- 
2014
9
1 358 
1
880 

Analysis

Structure of prices per m²

Values of price percentiles per m² over the periods used for the estimated price of each type of property.

Structure of transaction amounts

Values of transaction amounts percentiles over the periods used for the estimated price of each type of property.

Transaction amounts and prices per m² by percentile

Ascending order
Percentile
Houses
house
Price per m²
Houses
house
Transaction amount
Apartments
apt.
Price per m²
Apartments
apt.
Transaction amount
10th percentile
1 042 
65 750 
1 071 
89 300 
20th percentile
1 394 
150 K
1 098 
99 304 
30th percentile
1 649 
205 K
1 392 
127 K
40th percentile
1 999 
230 K
1 530 
148 K
50th percentile
2 014 
252 K
1 549 
161 K
60th percentile
2 292 
284 K
1 562 
180 K
70th percentile
2 458 
305 K
1 597 
207 K
80th percentile
2 659 
325 K
1 673 
226 K
90th percentile
2 944 
372 K
1 698 
250 K

National and departmental comparison

Evolution of the median price per m² of houses

Evolution of the median price per m² of apartments

Quarterly evolution

Evolution of the median price per m²

Evolution of the number of transactions

Quarterly data

Descending order
Quarter
Houses
house
transactions
Houses
house
Price per m²
Apartments
apt.
transactions
Apartments
apt.
Price per m²
2025 Q2
4
1 394 
0
--- 
2025 Q1
3
2 467 
0
--- 
2024 Q4
5
1 648 
1
1 517 
2024 Q3
4
2 371 
0
--- 
2024 Q2
3
2 288 
0
--- 
2024 Q1
2
2 654 
1
1 560 
2023 Q4
2
2 196 
0
--- 
2023 Q3
5
2 823 
0
--- 
2023 Q2
3
1 871 
0
--- 
2023 Q1
6
1 798 
0
--- 
2022 Q4
4
2 639 
0
--- 
2022 Q3
3
2 645 
1
1 087 
2022 Q2
3
3 088 
0
--- 
2022 Q1
3
1 885 
0
--- 
2021 Q4
2
1 872 
0
--- 
2021 Q3
8
2 192 
1
1 538 
2021 Q2
4
1 990 
0
--- 
2021 Q1
5
1 975 
1
1 566 
2020 Q4
5
2 313 
3
1 670 
2020 Q3
5
1 778 
2
1 306 
2020 Q2
1
2 703 
1
1 013 
2020 Q1
4
1 966 
0
--- 
2019 Q4
2
1 191 
0
--- 
2019 Q3
7
2 112 
0
--- 
2019 Q2
6
1 858 
0
--- 
2019 Q1
3
1 857 
1
1 495 
2018 Q4
3
1 833 
2
2 286 
2018 Q3
1
1 580 
1
1 185 
2018 Q2
4
1 998 
0
--- 
2018 Q1
9
1 024 
1
1 143 
2017 Q4
4
1 518 
2
1 158 
2017 Q3
8
1 901 
1
1 668 
2017 Q2
4
896 
0
--- 
2017 Q1
2
1 757 
0
--- 
2016 Q4
2
2 208 
1
2 790 
2016 Q3
8
1 669 
0
--- 
2016 Q2
7
1 750 
1
929 
2016 Q1
4
1 184 
0
--- 
2015 Q4
4
1 632 
0
--- 
2015 Q3
2
1 416 
0
--- 
2015 Q2
5
1 857 
0
--- 
2014 Q4
1
1 951 
0
--- 
2014 Q3
3
976 
1
880 
2014 Q1
5
1 358 
0
--- 

Overview of the latest real estate transactions

The following list is an anonymized overview of the latest transactions. For more details and to find all transactions, please use the map to view transactions by plot or the transaction search page for a search by criteria.

2025-06-30
355 300 
3 090  /m²(115 m²)
Sale
Houses
House
4 rooms
115 m2
Land
85 m2
-Sols
Land
285 m2
-Sols
Land
134 m2
-Sols
2025-06-23
95 000 
Sale
Land
667 m2
-Terres
2025-06-06
242 500 
1 650  /m²(147 m²)
Sale
Houses
House
5 rooms
147 m2
Land
400 m2
-Jardins
/Jardin potager
Land
538 m2
-Sols
Land
472 m2
-Vergers
2025-05-19
1 000 
Sale
Land
1989 m2
-Vergers
2025-05-07
55 000 
948  /m²(58 m²)
Sale
Houses
House
3 rooms
58 m2
1 outbuilding
Land
218 m2
-Sols
2025-05-05
3 750 
Sale
Land
875 m2
-Prés
Land
466 m2
-Vergers
Land
1056 m2
-Vergers
Land
602 m2
-Prés
Land
398 m2
-Vergers
Land
2503 m2
-Prés
Land
1595 m2
-Vergers
2025-04-28
284 300 
1 137  /m²(250 m²)
Sale
Houses
House
5 rooms
250 m2
Land
500 m2
-Sols
2025-03-28
74 000 
2 467  /m²(30 m²)
Sale
Houses
House
30 m2
Land
89 m2
-Sols
Land
60 m2
-Sols
2025-03-20
12 500 
Sale
Land
775 m2
-Taillis sous futaie
Land
790 m2
-Taillis sous futaie
Land
600 m2
-Taillis sous futaie
Land
1145 m2
-Taillis sous futaie
Land
382 m2
-Taillis sous futaie
Land
381 m2
-Taillis sous futaie
Land
382 m2
-Taillis sous futaie
2025-03-07
1 675 
Sale
Land
2846 m2
-Prés
Land
1342 m2
-Prés
2025-03-07
295 100 
2 659  /m²(111 m²)
Sale
Houses
House
4 rooms
111 m2
Land
500 m2
-Sols
Land
460 m2
-Jardins
/Jardin potager
2025-02-21
210 000 
2 000  /m²(105 m²)
Sale
Houses
House
4 rooms
105 m2
Land
496 m2
-Sols
Land
643 m2
-Jardins
/Jardin potager
2025-02-21
600 
Sale
Land
1115 m2
-Vergers
2025-02-13
1 683 
Sale
Land
561 m2
-Vergers
2025-02-06
1 
Sale
Land
24 m2
-Sols
2025-01-24
20 000 
Sale
Land
335 m2
-Jardins
/Jardin potager
2025-01-03
30 000 
Sale
Land
780 m2
-Vergers
2024-12-17
199 900 
1 999  /m²(100 m²)
Sale
Houses
House
3 rooms
100 m2
Land
248 m2
-Sols
2024-12-13
57 500 
311  /m²(185 m²)
Sale
Houses
House
6 rooms
185 m2
Land
741 m2
-Terres
Land
500 m2
-Sols
2024-12-10
180 000 
1 579  /m²(114 m²)
Sale
Houses
House
30 m2
Land
89 m2
-Sols
Houses
House
4 rooms
84 m2
Land
160 m2
-Sols
Land
60 m2
-Sols
439 transactions listed in the municipality

Meurthe-et-Moselle (54)

Most expensive cities

City
name
Descending orderHouses
house
Price per m²
3 544 
3 090 
2 984 
2 863 
2 824 
2 754 
2 724 
2 659 
2 633 
City
name
Descending orderApartments
apt.
Price per m²
3 571 
3 344 
2 819 
2 644 
2 641 
2 614 
2 558 
2 458 

Least expensive cities

City
name
Ascending orderHouses
house
Price per m²
259 
280 
320 
395 
412 
448 
448 
468 
City
name
Ascending orderApartments
apt.
Price per m²
157 
167 
169 
169 
245 
247 
261