emooki
HomePrice mapTransactions
🇬🇧 English🇫🇷 Français🇩🇪 Deutsch🇪🇸 Español🇮🇹 Italiano

Real estate price map


Real estate price map in the municipality of Villerupt, choose a section to see transactions by parcel.

Meurthe-et-Moselle (54)
Villerupt

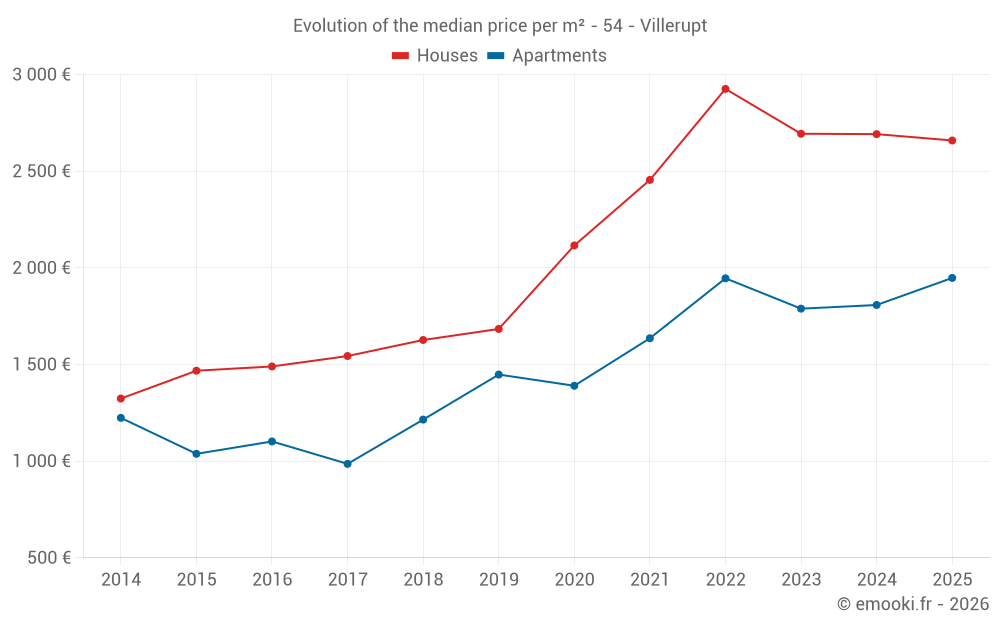
Median price of real estate
in the municipality of Villerupt

HousesHouses
2 659 € /m²
1-23-45-67-89-10
Reliability 9/10
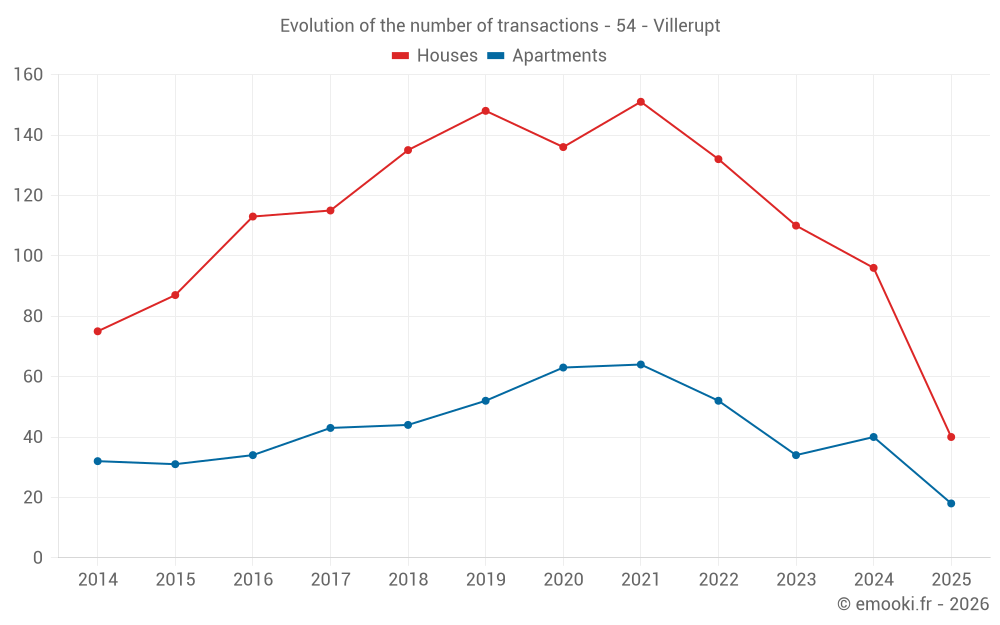
Median price on the 40 transactions of the last 6 months.
from 1 839 to
3 348 € /m²
60% of transactions from the 2nd to the 8th deciles.
ApartmentsApartments
1 948 € /m²
1-23-45-67-89-10
Reliability 9/10
Median price on the 18 transactions of the last 6 months.
from 1 608 to
2 417 € /m²
60% of transactions from the 2nd to the 8th deciles.
DwellingsDwellings
2 345 € /m²
1-23-45-67-89-10
Reliability 9/10
Median price on the 58 transactions of the last 6 months.
from 1 645 to
2 995 € /m²
60% of transactions from the 2nd to the 8th deciles.
HousesEvolution of the price per m² of houses since...
1 year
-1.2%
2 years
-1.3%
3 years
-9.1%
4 years
+8.3%
5 years
+26%
6 years
+58%
7 years
+63%
8 years
+72%
9 years
+78%
10 years
+81%
11 years
+101%
The price per m² of houses has decreased by 9.1% since 3 years, but it has increased by 101% in 11 years.
ApartmentsEvolution of the price per m² of apartments since...
1 year
+7.7%
2 years
+8.9%
3 years
+0.1%
4 years
+19%
5 years
+40%
6 years
+35%
7 years
+60%
8 years
+98%
9 years
+77%
10 years
+88%
11 years
+59%

Yearly evolution

Evolution of the median price per m²

Evolution of the number of transactions

Warning, last year incomplete. Projections made based on the proportions between semesters of the previous year at the departmental/national level and by type of property.

Yearly data

Descending order
Year
Houses
house
transactions
Houses
house
Price per m²
Apartments
apt.
transactions
Apartments
apt.
Price per m²
2025
40
2 659 €
18
1 948 €
2024
96
2 692 €
40
1 808 €
2023
110
2 694 €
34
1 789 €
2022
132
2 926 €
52
1 946 €
2021
151
2 455 €
64
1 636 €
2020
136
2 116 €
63
1 390 €
2019
148
1 684 €
52
1 448 €
2018
135
1 627 €
44
1 215 €
2017
115
1 544 €
43
986 €
2016
113
1 490 €
34
1 102 €
2015
87
1 468 €
31
1 038 €
2014
75
1 324 €
32
1 224 €

Analysis

Structure of prices per m²

Values of price percentiles per m² over the periods used for the estimated price of each type of property.

Structure of transaction amounts

Values of transaction amounts percentiles over the periods used for the estimated price of each type of property.

Transaction amounts and prices per m² by percentile

Ascending order
Percentile
Houses
house
Price per m²
Houses
house
Transaction amount
Apartments
apt.
Price per m²
Apartments
apt.
Transaction amount
10th percentile
1 256 €
84 100 €
1 543 €
70 750 €
20th percentile
1 839 €
113 K€
1 608 €
72 400 €
30th percentile
2 065 €
148 K€
1 660 €
79 991 €
40th percentile
2 354 €
187 K€
1 814 €
88 000 €
50th percentile
2 659 €
202 K€
1 948 €
121 K€
60th percentile
2 853 €
220 K€
2 051 €
142 K€
70th percentile
2 976 €
258 K€
2 219 €
153 K€
80th percentile
3 348 €
285 K€
2 417 €
169 K€
90th percentile
3 461 €
338 K€
2 485 €
185 K€

National and departmental comparison

Evolution of the median price per m² of houses

Evolution of the median price per m² of apartments

Quarterly evolution

Evolution of the median price per m²

Evolution of the number of transactions

Quarterly data

Descending order
Quarter
Houses
house
transactions
Houses
house
Price per m²
Apartments
apt.
transactions
Apartments
apt.
Price per m²
2025 Q2
9
2 880 €
7
1 897 €
2025 Q1
31
2 500 €
11
2 000 €
2024 Q4
27
2 720 €
15
1 730 €
2024 Q3
27
2 684 €
12
1 800 €
2024 Q2
18
2 555 €
4
1 890 €
2024 Q1
24
2 766 €
9
2 088 €
2023 Q4
16
2 364 €
10
1 675 €
2023 Q3
35
2 963 €
8
1 707 €
2023 Q2
25
2 765 €
9
1 786 €
2023 Q1
34
2 590 €
7
2 220 €
2022 Q4
30
3 147 €
14
1 836 €
2022 Q3
27
2 741 €
13
2 289 €
2022 Q2
47
2 950 €
13
1 941 €
2022 Q1
28
2 648 €
12
1 817 €
2021 Q4
37
2 316 €
15
1 975 €
2021 Q3
38
2 656 €
14
1 633 €
2021 Q2
38
2 270 €
19
1 585 €
2021 Q1
38
2 337 €
16
1 554 €
2020 Q4
36
2 288 €
21
1 390 €
2020 Q3
40
2 220 €
15
1 276 €
2020 Q2
39
2 103 €
14
1 466 €
2020 Q1
21
1 725 €
13
1 459 €
2019 Q4
29
1 706 €
14
1 424 €
2019 Q3
42
1 762 €
15
1 379 €
2019 Q2
39
1 463 €
11
1 500 €
2019 Q1
38
1 674 €
12
1 320 €
2018 Q4
35
1 667 €
10
1 355 €
2018 Q3
38
1 507 €
10
1 324 €
2018 Q2
37
1 667 €
13
1 182 €
2018 Q1
25
1 628 €
11
801 €
2017 Q4
35
1 476 €
9
1 358 €
2017 Q3
31
1 538 €
9
1 081 €
2017 Q2
35
1 607 €
13
1 000 €
2017 Q1
14
1 522 €
12
934 €
2016 Q4
30
1 349 €
6
1 102 €
2016 Q3
33
1 578 €
13
1 200 €
2016 Q2
27
1 585 €
6
1 010 €
2016 Q1
23
1 179 €
9
1 186 €
2015 Q4
27
1 379 €
11
1 014 €
2015 Q3
28
1 600 €
6
1 010 €
2015 Q2
21
1 489 €
8
948 €
2015 Q1
11
1 385 €
6
1 182 €
2014 Q4
20
1 332 €
6
1 222 €
2014 Q3
23
1 667 €
9
1 197 €
2014 Q2
21
1 244 €
6
1 174 €
2014 Q1
11
1 273 €
11
1 356 €

Overview of the latest real estate transactions

The following list is an anonymized overview of the latest transactions. For more details and to find all transactions, please use the map to view transactions by plot or the transaction search page for a search by criteria.

2025-06-26
95 000 €
1 696 € /m²(56 m²)
Sale
Houses
House
3 rooms
56 m2
Land
52 m2
-Sols
2025-06-25
283 850 €
2 957 € /m²(96 m²)
Sale
Houses
House
5 rooms
96 m2
Land
27 m2
-Sols
Land
27 m2
-Sols
Land
240 m2
-Sols
2025-06-23
116 500 €
2 427 € /m²(48 m²)
Sale
Houses
House
3 rooms
48 m2
1 outbuilding
Land
40 m2
-Sols
Commercial property
Land
17 m2
-Sols
2025-06-23
408 550 €
4 086 € /m²(100 m²)
Sale
Houses
House
4 rooms
100 m2
Land
329 m2
-Sols
2025-06-19
324 000 €
1 851 € /m²(175 m²)
Sale
Apartments
Apartment
6 rooms
175 m2
1 outbuilding
2025-06-12
139 000 €
2 574 € /m²(54 m²)
Sale
Apartments
Apartment
2 rooms
54 m2
1 outbuilding
2025-06-05
2 000 €
Sale
Land
80 m2
-Sols
2025-06-05
17 000 €
Sale
1 outbuilding
Land
18 m2
-Sols
2025-05-28
196 200 €
3 504 € /m²(56 m²)
Sale
Houses
House
3 rooms
56 m2
1 outbuilding
Land
42 m2
-Sols
1 outbuilding
Land
27 m2
-Sols
Land
734 m2
-Sols
Land
160 m2
-Jardins
Land
11 m2
-Sols
2025-05-27
90 000 €
2 045 € /m²(44 m²)
Sale
Apartments
Apartment
1 room
44 m2
1 outbuilding
2025-05-23
288 000 €
2 880 € /m²(100 m²)
Sale
Houses
House
5 rooms
100 m2
Land
60 m2
-Sols
2025-05-20
235 000 €
3 456 € /m²(68 m²)
Sale
Houses
House
3 rooms
68 m2
1 outbuilding
Land
196 m2
-Sols
Land
34 m2
-Landes
Land
26 m2
-Sols
2025-05-19
71 500 €
1 589 € /m²(45 m²)
Sale
Apartments
Apartment
2 rooms
45 m2
1 outbuilding
2025-05-15
110 000 €
1 897 € /m²(58 m²)
Sale
Apartments
Apartment
2 rooms
58 m2
1 outbuilding
2025-05-14
330 000 €
2 870 € /m²(115 m²)
Sale
Houses
House
5 rooms
115 m2
Land
448 m2
-Sols
2025-05-14
72 000 €
1 636 € /m²(44 m²)
Sale
Apartments
Apartment
1 room
44 m2
1 outbuilding
2025-05-12
85 000 €
924 € /m²(92 m²)
Sale
Houses
House
2 rooms
47 m2
Land
25 m2
-Sols
Houses
House
2 rooms
45 m2
1 outbuilding
Land
24 m2
-Sols
Land
1 m2
-Sols
Land
1 m2
-Sols
Land
2 m2
-Sols
Land
2 m2
-Sols
Land
8 m2
-Sols
2025-05-12
70 000 €
1 061 € /m²(66 m²)
Sale
Houses
House
3 rooms
66 m2
Land
60 m2
-Sols
Land
12 m2
-Jardins
2025-05-06
1 €
Sale
Land
2138 m2
-Sols
Land
22335 m2
-Sols
Land
842 m2
-Sols
Land
1 m2
-Sols
Land
6546 m2
-Landes
Land
1278 m2
-Landes
Land
18811 m2
-Terrains à bâtir
2025-04-29
14 000 €
Sale
1 outbuilding
Land
16 m2
-Sols
Land
2417 m2
-Sols
2369 transactions listed in the municipality

Meurthe-et-Moselle (54)

Most expensive cities

City
name
Descending orderHouses
house
Price per m²
3 544 €
3 090 €
2 984 €
2 863 €
2 826 €
2 824 €
2 754 €
2 724 €
2 659 €
2 633 €
City
name
Descending orderApartments
apt.
Price per m²
75 000 €
3 571 €
3 344 €
2 819 €
2 776 €
2 644 €
2 641 €
2 614 €
2 558 €
2 458 €

Least expensive cities

City
name
Ascending orderHouses
house
Price per m²
259 €
280 €
320 €
369 €
383 €
395 €
412 €
448 €
448 €
468 €
City
name
Ascending orderApartments
apt.
Price per m²
138 €
157 €
167 €
169 €
169 €
182 €
245 €
247 €
261 €