Real estate price map
Real estate price map in the municipality of Borville, choose a section to see transactions by parcel.
Meurthe-et-Moselle (54)
Price per m² in Borville
Median price of real estate
in the municipality of Borville
Houses
889 € /m²
Reliability 3/10
Median price on the 9 transactions of the last 72 months.
Yearly evolution
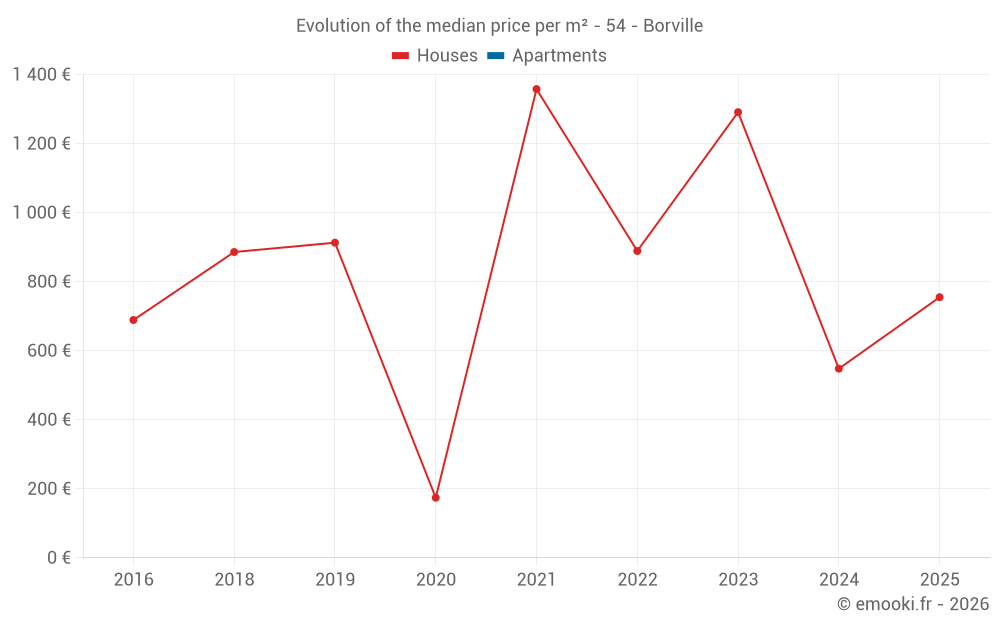
Evolution of the median price per m²
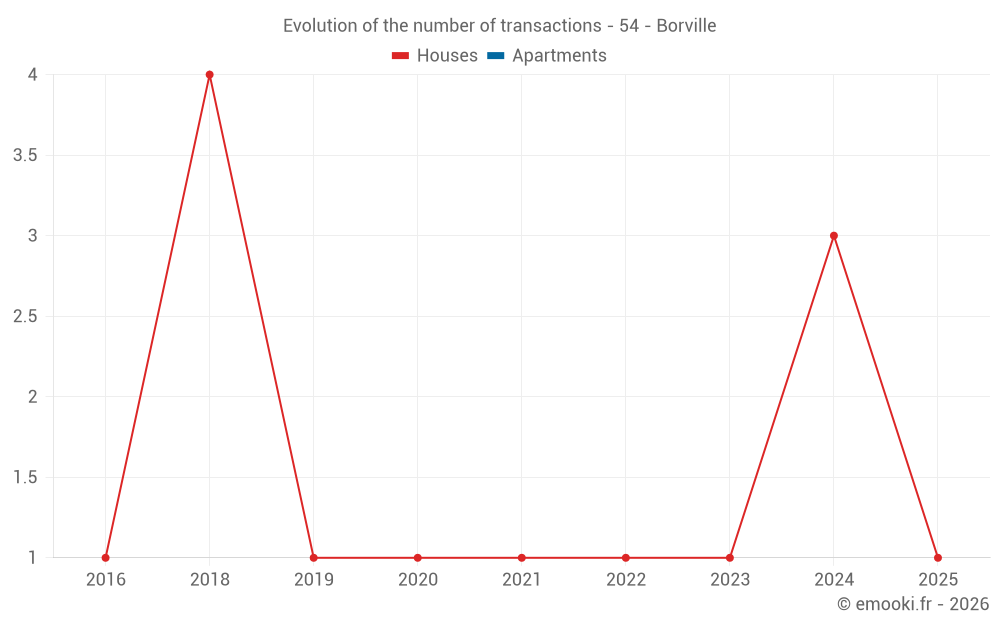
Evolution of the number of transactions
Warning, last year incomplete. Projections made based on the proportions between semesters of the previous year at the departmental/national level and by type of property.
Yearly data
Year
house
transactions
transactions
house
Price per m²
Price per m²
apt.
transactions
transactions
apt.
Price per m²
Price per m²
2025
1
755 €
0
--- €
2024
3
548 €
0
--- €
2023
1
1 291 €
0
--- €
2022
1
889 €
0
--- €
2021
1
1 358 €
0
--- €
2020
1
174 €
0
--- €
2019
1
913 €
0
--- €
2018
4
886 €
0
--- €
2017
0
--- €
0
--- €
2016
1
689 €
0
--- €
2015
0
--- €
0
--- €
2014
0
--- €
0
--- €
Analysis
Structure of prices per m²
Values of price percentiles per m² over the periods used for the estimated price of each type of property.
Structure of transaction amounts
Values of transaction amounts percentiles over the periods used for the estimated price of each type of property.
Transaction amounts and prices per m² by percentile
Percentile
house
Price per m²
Price per m²
house
Transaction amount
Transaction amount
apt.
Price per m²
Price per m²
apt.
Transaction amount
Transaction amount
10th percentile
455 €
37 600 €
--- €
--- €
20th percentile
539 €
51 000 €
--- €
--- €
30th percentile
631 €
66 200 €
--- €
--- €
40th percentile
782 €
80 000 €
--- €
--- €
50th percentile
889 €
80 000 €
--- €
--- €
60th percentile
908 €
111 K€
--- €
--- €
70th percentile
1 140 €
145 K€
--- €
--- €
80th percentile
1 318 €
185 K€
--- €
--- €
90th percentile
1 813 €
219 K€
--- €
--- €
National and departmental comparison
Evolution of the median price per m² of houses
Evolution of the median price per m² of apartments
Quarterly evolution
Evolution of the median price per m²
Evolution of the number of transactions
Quarterly data
Quarter
house
transactions
transactions
house
Price per m²
Price per m²
apt.
transactions
transactions
apt.
Price per m²
Price per m²
2025 Q1
1
755 €
0
--- €
2024 Q3
1
525 €
0
--- €
2024 Q2
1
548 €
0
--- €
2024 Q1
1
3 633 €
0
--- €
2023 Q2
1
1 291 €
0
--- €
2022 Q2
1
889 €
0
--- €
2021 Q4
1
1 358 €
0
--- €
2020 Q1
1
174 €
0
--- €
2019 Q3
1
913 €
0
--- €
2018 Q4
1
615 €
0
--- €
2018 Q3
1
1 156 €
0
--- €
2018 Q2
2
760 €
0
--- €
2016 Q2
1
689 €
0
--- €
Overview of the latest real estate transactions
The following list is an anonymized overview of the latest transactions. For more details and to find all transactions, please use the map to view transactions by plot or the transaction search page for a search by criteria.
2025-02-28
51 439 €Sale
Land
6846 m2
-Terres
Land
27789 m2
-Prés
Land
88 m2
-Terres
Land
720 m2
-Sols
Land
47095 m2
-Terres
Land
16382 m2
-Terres
Land
10394 m2
-Terres
Land
7540 m2
-Terres
Land
8830 m2
-Terres
Land
2913 m2
-Prés
2025-02-26
80 000 €755 € /m²(106 m²)
Sale
House
4 rooms
106 m2
Land
546 m2
-Sols
Land
873 m2
-Jardins
2024-08-16
42 000 €525 € /m²(80 m²)
Sale
House
3 rooms
80 m2
Land
245 m2
-Sols
Land
360 m2
-Prés
2024-07-25
25 000 €Sale
Land
20120 m2
-Prés
Land
1528 m2
-Vergers
Land
16400 m2
-Terres
Land
1558 m2
-Prés
Land
7980 m2
-Prés
Land
14841 m2
-Terres
Land
442 m2
-Prés
2024-06-05
9 860 €Sale
Land
19721 m2
-Terres
2024-05-30
3 911 €Sale
Land
7132 m2
-Prés
Land
3566 m2
-Taillis simples
Land
1962 m2
-Prés
2024-05-28
2 673 €Sale
Land
2963 m2
-Terres
Land
2964 m2
-Vergers
2024-05-23
57 000 €548 € /m²(104 m²)
Sale
House
3 rooms
104 m2
Land
150 m2
-Sols
Land
482 m2
-Sols
2024-01-15
218 000 €3 633 € /m²(60 m²)
Sale
House
2 rooms
60 m2
Land
399 m2
-Sols
Land
410 m2
-Prés
2023-12-22
5 000 €Sale
Land
2278 m2
-Terres
2023-05-12
1 374 €Sale
Land
3436 m2
-Terres
2023-05-09
222 000 €1 291 € /m²(172 m²)
Sale
House
7 rooms
172 m2
Land
312 m2
-Sols
Land
278 m2
-Vergers
Land
500 m2
-Jardins
Land
622 m2
-Vergers
2023-04-25
14 140 €Sale
Land
38205 m2
-Terres
2022-12-22
52 438 €transaction.nature.Vente terrain à bâtir
Land
5000 m2
-Terres
Land
1070 m2
-Taillis simples
Land
82365 m2
-Terres
Land
532 m2
-Terres
Land
25974 m2
-Terres
Land
25973 m2
-Terres
Land
1824 m2
-Prés
Land
17593 m2
-Prés
Land
17594 m2
-Prés
Land
3315 m2
-Prés
Land
8370 m2
-Prés
2022-05-25
2 962 €Sale
Land
7404 m2
-Vergers
2022-04-29
80 000 €889 € /m²(90 m²)
Sale
House
3 rooms
90 m2
1 outbuilding
Land
1055 m2
-Sols
Land
840 m2
-Vergers
2021-12-15
163 000 €1 358 € /m²(120 m²)
Sale
Land
88 m2
-Sols
House
4 rooms
120 m2
Land
550 m2
-Sols
Land
162 m2
-Sols
2020-12-07
15 000 €Sale
Land
2024 m2
-Sols
2020-02-18
15 000 €Sale
Land
2024 m2
-Sols
2020-02-14
20 000 €174 € /m²(115 m²)
Sale
House
5 rooms
115 m2
Land
490 m2
-Sols
Land
750 m2
-Jardins
32 transactions listed in the municipality
Compare with neighboring municipalities
City
name
name
house
Price per m²
Price per m²
apt.
Price per m²
Price per m²
City information
Zip code
- 54290 BORVILLE
Data source & update
- Latest publication of the property value request (DVF) database made available by the DGFiP on October 19, 2025, covering transactions up to 06/30/2025:
- Administrative/cadastral division as of September 1, 2025, and municipal movements as of January 1, 2025: