Real estate price map
Real estate price map in the municipality of Gorron, choose a section to see transactions by parcel.
Mayenne (53)
Price per m² in Gorron
Median price of real estate
in the municipality of Gorron
Houses
1 023 € /m²
Reliability 9/10
Median price on the 28 transactions of the last 6 months.
from 710 to
1 259 € /m²
1 259 € /m²
60% of transactions from the 2nd to the 8th deciles.
Apartments
551 € /m²
Reliability 4/10
Median price on the 11 transactions of the last 60 months.
from 285 to
795 € /m²
795 € /m²
60% of transactions from the 2nd to the 8th deciles.
Dwellings
1 023 € /m²
Reliability 9/10
Median price on the 29 transactions of the last 6 months.
from 711 to
1 248 € /m²
1 248 € /m²
60% of transactions from the 2nd to the 8th deciles.
Evolution of the price per m² of houses since...
1 year
+11%
2 years
+13%
3 years
+31%
4 years
+38%
5 years
+34%
6 years
+28%
7 years
+18%
8 years
+50%
9 years
+29%
10 years
+23%
11 years
+18%
706 transactions listed in the municipality
Yearly data
Yearly evolution of the median price per m²

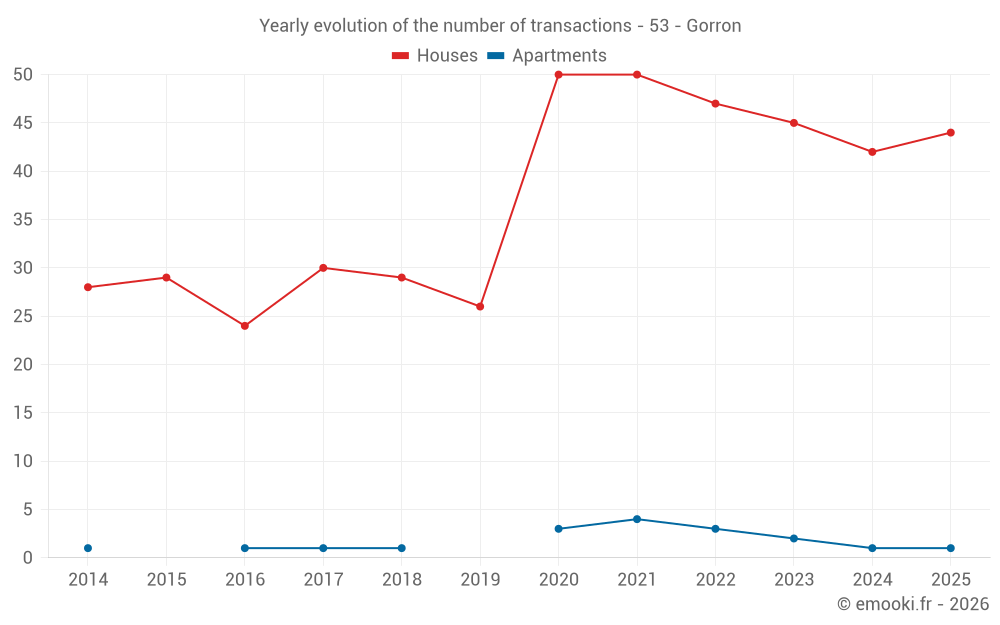
Yearly evolution of the number of transactions
Yearly table
Year
house
transactions
transactions
house
Price per m²
Price per m²
apt.
transactions
transactions
apt.
Price per m²
Price per m²
2025
44
1 048 €
1
795 €
2024
42
942 €
1
958 €
2023
45
928 €
2
304 €
2022
47
800 €
3
285 €
2021
50
761 €
4
598 €
2020
50
784 €
3
545 €
2019
26
818 €
0
--- €
2018
29
890 €
1
326 €
2017
30
698 €
1
599 €
2016
24
810 €
1
321 €
2015
29
854 €
0
--- €
2014
28
890 €
1
694 €
Analysis
Structure of prices per m²
Values of price percentiles per m² over the periods used for the estimated price of each type of property.
Structure of transaction amounts
Values of transaction amounts percentiles over the periods used for the estimated price of each type of property.
Transaction amounts and prices per m² by percentile
Percentile
house
Price per m²
Price per m²
house
Transaction amount
Transaction amount
apt.
Price per m²
Price per m²
apt.
Transaction amount
Transaction amount
10th percentile
519 €
34 900 €
281 €
31 000 €
20th percentile
710 €
53 800 €
285 €
35 000 €
30th percentile
774 €
70 300 €
407 €
40 250 €
40th percentile
906 €
89 000 €
438 €
43 600 €
50th percentile
1 023 €
98 000 €
551 €
46 000 €
60th percentile
1 060 €
117 K€
567 €
47 000 €
70th percentile
1 175 €
152 K€
644 €
59 000 €
80th percentile
1 259 €
164 K€
795 €
65 000 €
90th percentile
1 779 €
206 K€
840 €
110 K€
National and departmental comparison
Evolution of the median price per m² of houses
Evolution of the median price per m² of apartments
Quarterly data
Quarterly evolution of the median price per m²
Quarterly evolution of the number of transactions
Quarterly table
Quarter
house
transactions
transactions
house
Price per m²
Price per m²
apt.
transactions
transactions
apt.
Price per m²
Price per m²
2025 Q4
14
744 €
1
795 €
2025 Q3
14
1 185 €
0
--- €
2025 Q2
9
1 143 €
0
--- €
2025 Q1
7
1 355 €
0
--- €
2024 Q4
14
853 €
0
--- €
2024 Q3
11
903 €
0
--- €
2024 Q2
7
1 023 €
0
--- €
2024 Q1
10
996 €
1
958 €
2023 Q4
8
1 142 €
1
438 €
2023 Q3
13
662 €
0
--- €
2023 Q2
12
958 €
1
170 €
2023 Q1
12
806 €
0
--- €
2022 Q4
9
800 €
0
--- €
2022 Q3
11
908 €
0
--- €
2022 Q2
12
722 €
1
567 €
2022 Q1
15
747 €
2
283 €
2021 Q4
12
871 €
1
407 €
2021 Q3
20
761 €
1
551 €
2021 Q2
7
928 €
2
742 €
2021 Q1
11
750 €
0
--- €
2020 Q4
19
708 €
2
586 €
2020 Q3
13
1 077 €
0
--- €
2020 Q2
8
636 €
1
545 €
2020 Q1
10
704 €
0
--- €
2019 Q4
4
706 €
0
--- €
2019 Q3
8
1 002 €
0
--- €
2019 Q2
11
846 €
0
--- €
2019 Q1
3
461 €
0
--- €
2018 Q4
10
1 002 €
0
--- €
2018 Q3
8
954 €
0
--- €
2018 Q2
4
810 €
1
326 €
2018 Q1
7
661 €
0
--- €
2017 Q4
8
821 €
0
--- €
2017 Q3
6
626 €
1
599 €
2017 Q2
9
641 €
0
--- €
2017 Q1
7
593 €
0
--- €
2016 Q4
9
745 €
0
--- €
2016 Q3
9
817 €
0
--- €
2016 Q2
1
1 188 €
0
--- €
2016 Q1
5
805 €
1
321 €
2015 Q4
6
752 €
0
--- €
2015 Q3
7
759 €
0
--- €
2015 Q2
9
1 101 €
0
--- €
2015 Q1
7
1 000 €
0
--- €
2014 Q4
9
939 €
0
--- €
2014 Q3
7
766 €
0
--- €
2014 Q2
4
649 €
0
--- €
2014 Q1
8
968 €
1
694 €
Key takeaways
What is the price per m2 of houses in Gorron?
The median price on the 28 house transactions of the last 6 months in the municipality of Gorron was 1 023 € per square meter for a median property value of 98 000 €. Over this period, 60% of transactions were between 710 and 1 259 € per square meter (from the 2nd to the 8th deciles).
Compare with neighboring municipalities
City
name
name
house
Price per m²
Price per m²
apt.
Price per m²
Price per m²
City information
Zip code
- 53120 GORRON