emooki
HomePrice mapTransactions
🇬🇧 English🇫🇷 Français🇩🇪 Deutsch🇪🇸 Español🇮🇹 Italiano

Real estate price map


Real estate price map in the Haute-Marne department.

Department 52
Haute-Marne

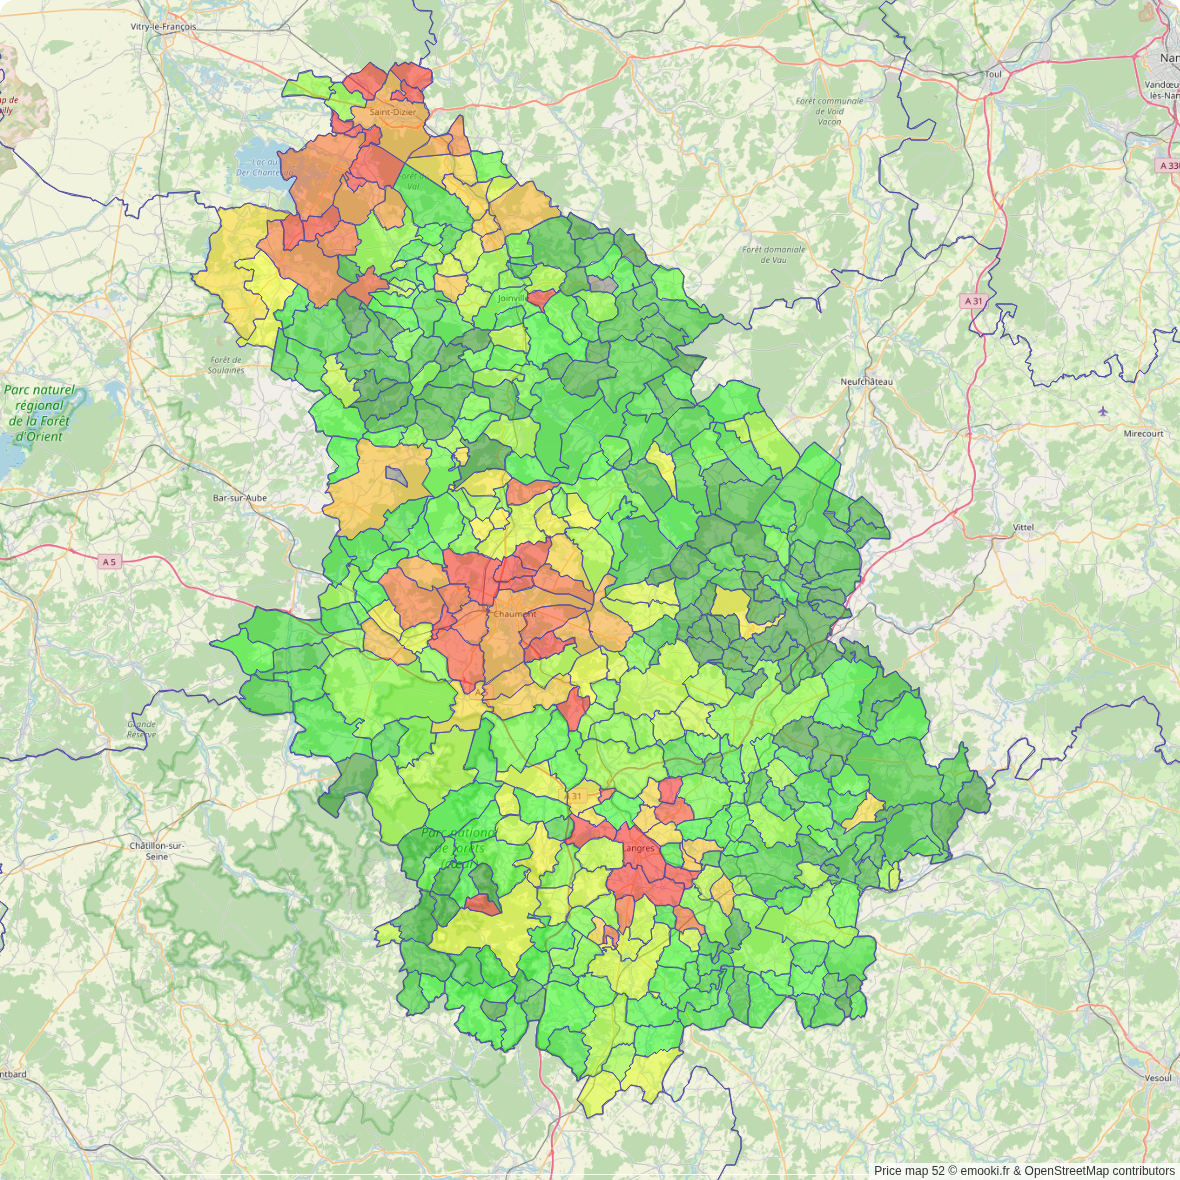
Median price of real estate
in the Haute-Marne department

HousesHouses
899 € /m²
1-23-45-67-89-10
Reliability 10/10
Median price on the 256 transactions of the last 3 months.
from 394 to
1 509 € /m²
60% of transactions from the 2nd to the 8th deciles.
ApartmentsApartments
1 071 € /m²
1-23-45-67-89-10
Reliability 9/10
Median price on the 109 transactions of the last 6 months.
from 646 to
1 344 € /m²
60% of transactions from the 2nd to the 8th deciles.
DwellingsDwellings
910 € /m²
1-23-45-67-89-10
Reliability 10/10
Median price on the 299 transactions of the last 3 months.
from 406 to
1 482 € /m²
60% of transactions from the 2nd to the 8th deciles.
HousesEvolution of the price per m² of houses since...
1 year
-3.3%
2 years
-1.4%
3 years
-1.9%
4 years
+1.5%
5 years
+10%
6 years
+5.9%
7 years
+0.3%
8 years
+9.2%
9 years
+11%
10 years
+7.4%
11 years
+2.6%
ApartmentsEvolution of the price per m² of apartments since...
1 year
+4.5%
2 years
-0.1%
3 years
+6.5%
4 years
+12%
5 years
+15%
6 years
+17%
7 years
+20%
8 years
+17%
9 years
+14%
10 years
+21%
11 years
+6.4%

Yearly evolution

Evolution of the median price per m²

Evolution of the number of transactions

Warning, last year incomplete. Projections made based on the proportions between semesters of the previous year at the departmental/national level and by type of property.

Yearly data

Descending order
Year
Houses
house
transactions
Houses
house
Price per m²
Apartments
apt.
transactions
Apartments
apt.
Price per m²
2025
617
875 €
109
1 071 €
2024
1 729
905 €
223
1 025 €
2023
1 884
887 €
294
1 072 €
2022
2 236
892 €
327
1 006 €
2021
2 307
862 €
304
953 €
2020
1 803
798 €
258
928 €
2019
1 877
826 €
281
917 €
2018
1 694
872 €
232
895 €
2017
1 708
801 €
225
912 €
2016
1 563
786 €
192
942 €
2015
1 526
815 €
197
882 €
2014
1 299
853 €
169
1 007 €

Analysis

Structure of prices per m²

Values of price percentiles per m² over the periods used for the estimated price of each type of property.

Structure of transaction amounts

Values of transaction amounts percentiles over the periods used for the estimated price of each type of property.

Transaction amounts and prices per m² by percentile

Ascending order
Percentile
Houses
house
Price per m²
Houses
house
Transaction amount
Apartments
apt.
Price per m²
Apartments
apt.
Transaction amount
10th percentile
222 €
20 000 €
442 €
39 200 €
20th percentile
394 €
32 000 €
646 €
50 000 €
30th percentile
547 €
45 500 €
831 €
62 158 €
40th percentile
720 €
62 500 €
940 €
70 400 €
50th percentile
899 €
81 000 €
1 071 €
80 000 €
60th percentile
1 080 €
105 K€
1 153 €
91 600 €
70th percentile
1 295 €
129 K€
1 225 €
105 K€
80th percentile
1 509 €
151 K€
1 344 €
122 K€
90th percentile
1 724 €
184 K€
1 480 €
167 K€

Quarterly evolution

Evolution of the median price per m²

Evolution of the number of transactions

Quarterly data

Descending order
Quarter
Houses
house
transactions
Houses
house
Price per m²
Apartments
apt.
transactions
Apartments
apt.
Price per m²
2025 Q2
256
899 €
43
922 €
2025 Q1
361
857 €
66
1 116 €
2024 Q4
504
866 €
59
959 €
2024 Q3
476
1 026 €
53
980 €
2024 Q2
392
923 €
53
1 100 €
2024 Q1
357
820 €
58
1 060 €
2023 Q4
458
848 €
72
1 044 €
2023 Q3
501
966 €
83
1 022 €
2023 Q2
468
934 €
63
1 071 €
2023 Q1
457
796 €
76
1 132 €
2022 Q4
540
876 €
68
986 €
2022 Q3
626
974 €
93
1 061 €
2022 Q2
561
877 €
95
968 €
2022 Q1
509
851 €
71
1 023 €
2021 Q4
633
917 €
77
954 €
2021 Q3
641
922 €
78
944 €
2021 Q2
579
808 €
90
948 €
2021 Q1
454
761 €
59
977 €
2020 Q4
636
788 €
66
927 €
2020 Q3
477
854 €
74
880 €
2020 Q2
351
745 €
56
918 €
2020 Q1
339
787 €
62
982 €
2019 Q4
489
794 €
63
952 €
2019 Q3
545
932 €
87
873 €
2019 Q2
449
770 €
70
954 €
2019 Q1
394
833 €
61
941 €
2018 Q4
460
826 €
62
822 €
2018 Q3
455
977 €
55
882 €
2018 Q2
359
833 €
51
978 €
2018 Q1
420
810 €
64
894 €
2017 Q4
449
816 €
65
894 €
2017 Q3
451
825 €
41
948 €
2017 Q2
412
790 €
69
918 €
2017 Q1
396
768 €
50
905 €
2016 Q4
436
792 €
56
902 €
2016 Q3
429
833 €
48
962 €
2016 Q2
365
759 €
51
938 €
2016 Q1
333
762 €
37
959 €
2015 Q4
440
835 €
56
905 €
2015 Q3
443
820 €
37
833 €
2015 Q2
341
803 €
62
852 €
2015 Q1
302
800 €
42
920 €
2014 Q4
328
799 €
50
998 €
2014 Q3
388
938 €
46
1 050 €
2014 Q2
310
877 €
36
952 €
2014 Q1
273
823 €
37
941 €

Haute-Marne (52)

Most expensive cities

City
name
Descending orderHouses
house
Price per m²
2 002 €
1 647 €
1 638 €
1 615 €
1 586 €
1 566 €
1 549 €
1 548 €
1 510 €
1 505 €
City
name
Descending orderApartments
apt.
Price per m²
5 121 €
1 278 €
1 174 €
1 158 €
1 156 €
1 071 €
1 053 €
1 040 €
1 010 €
990 €

Least expensive cities

City
name
Ascending orderHouses
house
Price per m²
60 €
142 €
150 €
156 €
180 €
182 €
193 €
209 €
212 €
City
name
Ascending orderApartments
apt.
Price per m²
3 €
15 €
125 €
140 €
156 €
159 €
160 €
171 €
215 €