Real estate price map
Real estate price map in the municipality of Briaucourt, choose a section to see transactions by parcel.
Haute-Marne (52)
Price per m² in Briaucourt
Median price of real estate
in the municipality of Briaucourt
Houses
1 000 € /m²
Reliability 6/10
Median price on the 13 transactions of the last 36 months.
from 524 to
1 352 € /m²
1 352 € /m²
60% of transactions from the 2nd to the 8th deciles.
Yearly evolution
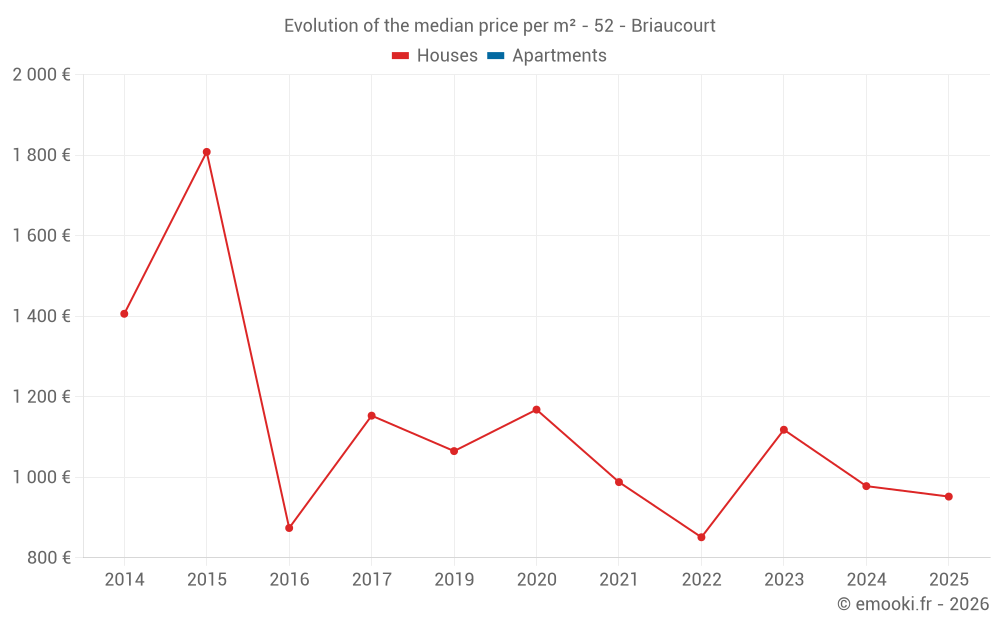
Evolution of the median price per m²
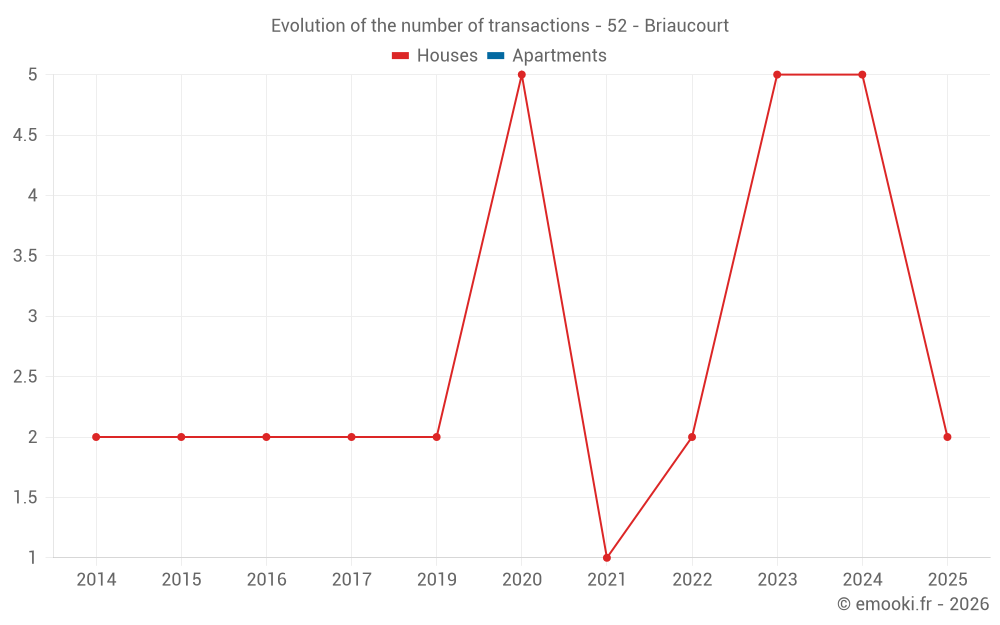
Evolution of the number of transactions
Warning, last year incomplete. Projections made based on the proportions between semesters of the previous year at the departmental/national level and by type of property.
Yearly data
Year
house
transactions
transactions
house
Price per m²
Price per m²
apt.
transactions
transactions
apt.
Price per m²
Price per m²
2025
2
952 €
0
--- €
2024
5
978 €
0
--- €
2023
5
1 118 €
0
--- €
2022
2
851 €
0
--- €
2021
1
988 €
0
--- €
2020
5
1 168 €
0
--- €
2019
2
1 065 €
0
--- €
2018
0
--- €
0
--- €
2017
2
1 153 €
0
--- €
2016
2
874 €
0
--- €
2015
2
1 808 €
0
--- €
2014
2
1 406 €
0
--- €
Analysis
Structure of prices per m²
Values of price percentiles per m² over the periods used for the estimated price of each type of property.
Structure of transaction amounts
Values of transaction amounts percentiles over the periods used for the estimated price of each type of property.
Transaction amounts and prices per m² by percentile
Percentile
house
Price per m²
Price per m²
house
Transaction amount
Transaction amount
apt.
Price per m²
Price per m²
apt.
Transaction amount
Transaction amount
10th percentile
461 €
33 200 €
--- €
--- €
20th percentile
524 €
64 480 €
--- €
--- €
30th percentile
765 €
92 680 €
--- €
--- €
40th percentile
967 €
110 K€
--- €
--- €
50th percentile
1 000 €
123 K€
--- €
--- €
60th percentile
1 067 €
129 K€
--- €
--- €
70th percentile
1 194 €
152 K€
--- €
--- €
80th percentile
1 352 €
161 K€
--- €
--- €
90th percentile
1 391 €
169 K€
--- €
--- €
National and departmental comparison
Evolution of the median price per m² of houses
Evolution of the median price per m² of apartments
Quarterly evolution
Evolution of the median price per m²
Evolution of the number of transactions
Quarterly data
Quarter
house
transactions
transactions
house
Price per m²
Price per m²
apt.
transactions
transactions
apt.
Price per m²
Price per m²
2025 Q2
1
1 382 €
0
--- €
2025 Q1
1
522 €
0
--- €
2024 Q4
1
1 054 €
0
--- €
2024 Q2
2
960 €
0
--- €
2024 Q1
2
712 €
0
--- €
2023 Q3
1
235 €
0
--- €
2023 Q2
2
1 409 €
0
--- €
2023 Q1
2
1 154 €
0
--- €
2022 Q4
1
924 €
0
--- €
2022 Q2
1
778 €
0
--- €
2021 Q1
1
988 €
0
--- €
2020 Q4
2
1 192 €
0
--- €
2020 Q3
2
872 €
0
--- €
2020 Q1
1
1 168 €
0
--- €
2019 Q4
1
1 512 €
0
--- €
2019 Q2
1
618 €
0
--- €
2017 Q1
2
1 153 €
0
--- €
2016 Q4
1
1 056 €
0
--- €
2016 Q2
1
691 €
0
--- €
2015 Q4
1
1 731 €
0
--- €
2015 Q3
1
1 884 €
0
--- €
2014 Q2
1
1 740 €
0
--- €
2014 Q1
1
1 073 €
0
--- €
Overview of the latest real estate transactions
The following list is an anonymized overview of the latest transactions. For more details and to find all transactions, please use the map to view transactions by plot or the transaction search page for a search by criteria.
2025-04-28
123 000 €1 382 € /m²(89 m²)
Sale
House
3 rooms
89 m2
Land
249 m2
-Sols
Land
132 m2
-Jardins
/Jardin potager
2025-01-28
3 800 €Sale
Land
9 m2
-Sols
Land
968 m2
-Prés
Land
49 m2
-Landes
2025-01-28
86 200 €522 € /m²(165 m²)
Sale
House
4 rooms
165 m2
Land
1226 m2
-Sols
Land
17 m2
-Prés
Land
848 m2
-Prés
2024-10-11
97 000 €1 054 € /m²(92 m²)
Sale
House
5 rooms
92 m2
Land
745 m2
-Sols
2024-06-21
50 000 €526 € /m²(95 m²)
Sale
House
3 rooms
95 m2
2 outbuildings
Land
494 m2
-Sols
2024-04-15
170 000 €1 393 € /m²(122 m²)
Sale
House
4 rooms
122 m2
1 outbuilding
Land
289 m2
-Sols
Land
480 m2
-Jardins
/Jardin potager
Land
790 m2
-Prés
2024-03-18
166 300 €978 € /m²(170 m²)
Sale
House
4 rooms
170 m2
Land
91 m2
-Sols
Land
73 m2
-Sols
Land
297 m2
-Jardins
/Jardin potager
Land
336 m2
-Sols
2024-03-01
29 000 €446 € /m²(65 m²)
Sale
House
3 rooms
65 m2
Land
705 m2
-Sols
Land
111 m2
-Prés
Land
387 m2
-Jardins
/Jardin potager
2023-09-22
215 000 €Sale
Land
837 m2
-Prés
Land
5466 m2
-Prés
Land
23193 m2
-Taillis simples
Land
2549 m2
-Prés
Land
1672 m2
-Taillis simples
Land
9247 m2
-Taillis sous futaie
Land
39960 m2
-Taillis sous futaie
Land
39940 m2
-Taillis sous futaie
Land
36900 m2
-Taillis sous futaie
2023-08-29
633 €Sale
Land
172 m2
-Landes
Land
3331 m2
-Taillis simples
Land
1283 m2
-Prés
Land
970 m2
-Prés
Land
405 m2
-Vergers
Land
595 m2
-Terres
2023-08-29
15 250 €235 € /m²(65 m²)
Sale
House
2 rooms
65 m2
Land
557 m2
-Sols
Land
1288 m2
-Prés
2023-06-09
170 000 €1 700 € /m²(100 m²)
Sale
House
4 rooms
100 m2
Land
851 m2
-Sols
2023-05-17
123 000 €1 118 € /m²(110 m²)
Sale
House
6 rooms
110 m2
Land
943 m2
-Sols
2023-03-10
6 000 €Sale
Land
140 m2
-Sols
2023-02-24
152 000 €1 000 € /m²(152 m²)
Sale
House
5 rooms
152 m2
Land
651 m2
-Prés
Land
1381 m2
-Sols
2023-01-09
113 750 €1 307 € /m²(87 m²)
Sale
House
4 rooms
87 m2
Land
937 m2
-Sols
2022-11-18
152 520 €924 € /m²(165 m²)
Sale
House
6 rooms
165 m2
1 outbuilding
Land
454 m2
-Sols
Land
630 m2
-Taillis sous futaie
Land
1500 m2
-Taillis sous futaie
Land
278 m2
-Taillis sous futaie
Land
476 m2
-Jardins
/Jardin potager
Land
160 m2
-Taillis simples
2022-10-11
1 500 €Sale
Land
1135 m2
-Vergers
Land
2440 m2
-Terres
2022-09-22
3 000 €Sale
Land
8292 m2
-Futaies résineuses
Land
5286 m2
-Terres
Land
1852 m2
-Futaies résineuses
2022-04-26
66 100 €778 € /m²(85 m²)
Sale
House
3 rooms
85 m2
Land
243 m2
-Sols
Land
65 m2
-Jardins
/Jardin potager
41 transactions listed in the municipality
Compare with neighboring municipalities
City
name
name
house
Price per m²
Price per m²
apt.
Price per m²
Price per m²
City information
Zip code
- 52700 BRIAUCOURT
Data source & update
- Latest publication of the property value request (DVF) database made available by the DGFiP on October 19, 2025, covering transactions up to 06/30/2025:
- Administrative/cadastral division as of September 1, 2025, and municipal movements as of January 1, 2025: