Real estate price map
Real estate price map in the municipality of Thol-lès-Millières, choose a section to see transactions by parcel.
Haute-Marne (52)
Price per m² in Thol-lès-Millières
Median price of real estate
in the municipality of Thol-lès-Millières
Houses
436 € /m²
Reliability 2/10
Median price on the 6 transactions of the last 96 months.
Yearly evolution
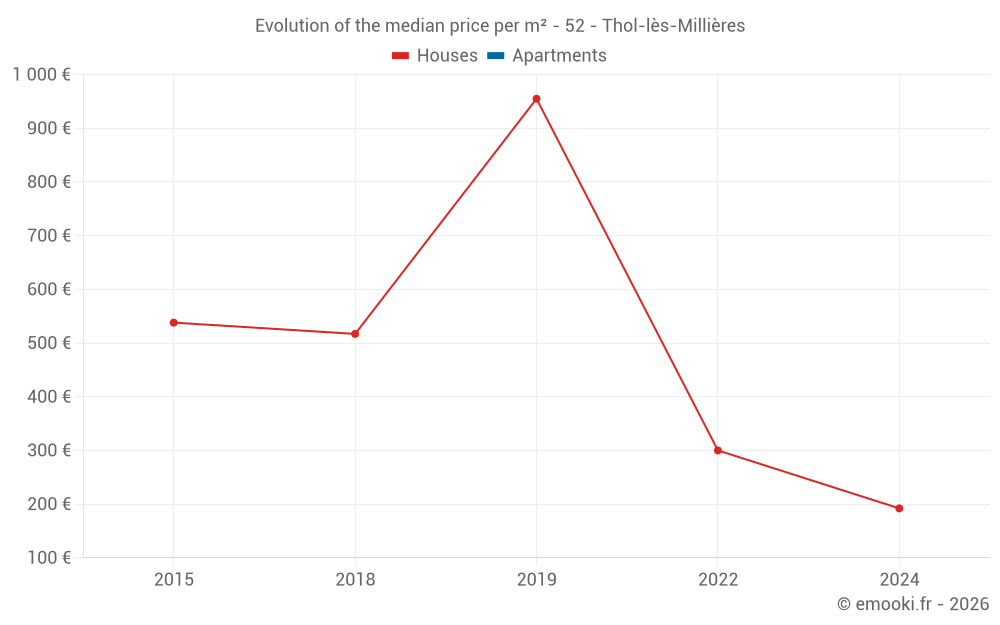
Evolution of the median price per m²
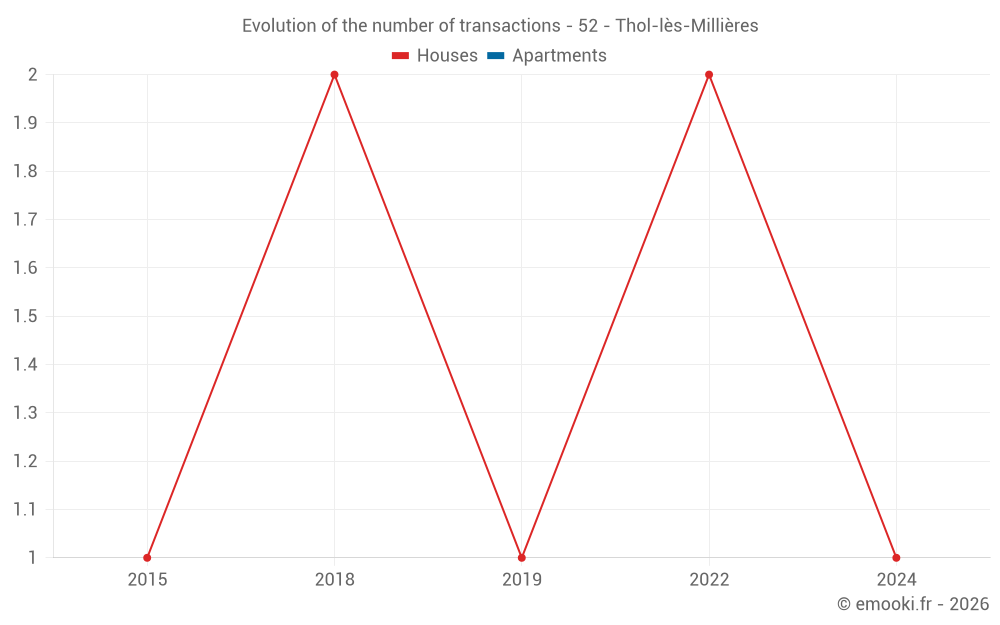
Evolution of the number of transactions
Warning, last year incomplete. Projections made based on the proportions between semesters of the previous year at the departmental/national level and by type of property.
Yearly data
Year
house
transactions
transactions
house
Price per m²
Price per m²
apt.
transactions
transactions
apt.
Price per m²
Price per m²
2025
0
--- €
0
--- €
2024
1
192 €
0
--- €
2023
0
--- €
0
--- €
2022
2
300 €
0
--- €
2021
0
--- €
0
--- €
2020
0
--- €
0
--- €
2019
1
955 €
0
--- €
2018
2
517 €
0
--- €
2017
0
--- €
0
--- €
2016
0
--- €
0
--- €
2015
1
538 €
0
--- €
2014
0
--- €
0
--- €
Analysis
Structure of prices per m²
Values of price percentiles per m² over the periods used for the estimated price of each type of property.
Structure of transaction amounts
Values of transaction amounts percentiles over the periods used for the estimated price of each type of property.
Transaction amounts and prices per m² by percentile
Percentile
house
Price per m²
Price per m²
house
Transaction amount
Transaction amount
apt.
Price per m²
Price per m²
apt.
Transaction amount
Transaction amount
10th percentile
149 €
19 375 €
--- €
--- €
20th percentile
192 €
25 000 €
--- €
--- €
30th percentile
286 €
33 000 €
--- €
--- €
40th percentile
379 €
41 000 €
--- €
--- €
50th percentile
436 €
45 500 €
--- €
--- €
60th percentile
494 €
50 000 €
--- €
--- €
70th percentile
574 €
61 000 €
--- €
--- €
80th percentile
655 €
72 000 €
--- €
--- €
90th percentile
805 €
83 750 €
--- €
--- €
National and departmental comparison
Evolution of the median price per m² of houses
Evolution of the median price per m² of apartments
Quarterly evolution
Evolution of the median price per m²
Evolution of the number of transactions
Quarterly data
Quarter
house
transactions
transactions
house
Price per m²
Price per m²
apt.
transactions
transactions
apt.
Price per m²
Price per m²
2024 Q1
1
192 €
0
--- €
2022 Q1
2
300 €
0
--- €
2019 Q2
1
955 €
0
--- €
2018 Q4
1
655 €
0
--- €
2018 Q1
1
379 €
0
--- €
2015 Q3
1
538 €
0
--- €
Overview of the latest real estate transactions
The following list is an anonymized overview of the latest transactions. For more details and to find all transactions, please use the map to view transactions by plot or the transaction search page for a search by criteria.
2024-03-18
25 000 €192 € /m²(130 m²)
Sale
House
4 rooms
130 m2
Land
351 m2
-Sols
Land
1011 m2
-Prés
2023-06-08
500 €Sale
Land
320 m2
-Sols
2022-10-12
6 000 €Sale
Land
310 m2
-Sols
2022-07-08
3 000 €Sale
Land
1500 m2
-Prés
2022-02-04
41 000 €494 € /m²(83 m²)
Sale
House
3 rooms
83 m2
Land
465 m2
-Sols
Land
940 m2
-Jardins
2022-02-04
13 750 €106 € /m²(130 m²)
Sale
House
4 rooms
130 m2
Land
1011 m2
-Prés
Land
351 m2
-Sols
2021-08-09
42 000 €Sale
Land
2030 m2
-Terres
Land
4800 m2
-Terres
Land
39855 m2
-Terres
Land
13285 m2
-Terres
Land
13370 m2
-Terres
Land
53480 m2
-Terres
2020-10-08
3 000 €Sale
Land
3910 m2
-Futaies résineuses
Land
11570 m2
-Futaies résineuses
2019-05-07
95 500 €955 € /m²(100 m²)
Sale
House
2 rooms
100 m2
Land
20 m2
-Sols
Land
2250 m2
-Jardins
Land
240 m2
-Terres
Land
300 m2
-Sols
Land
2 m2
-Sols
Land
40 m2
-Sols
2018-12-20
72 000 €655 € /m²(110 m²)
Sale
House
3 rooms
110 m2
Land
794 m2
-Jardins
Land
486 m2
-Sols
Land
6830 m2
-Prés
2018-02-28
50 000 €379 € /m²(132 m²)
Sale
House
5 rooms
132 m2
Land
1600 m2
-Sols
2018-02-28
400 €Sale
Land
810 m2
-Futaies résineuses
2017-06-28
500 €Sale
Land
470 m2
-Jardins
2015-07-27
70 000 €538 € /m²(130 m²)
Sale
House
4 rooms
130 m2
Land
770 m2
-Jardins
Land
2389 m2
-Prés
Land
1134 m2
-Sols
2015-03-06
1 500 €Sale
Land
240 m2
-Terres
Land
300 m2
-Sols
2014-03-28
500 €Sale
Land
193 m2
-Prés
2014-03-28
62 722 €Sale
Land
7099 m2
-Prés
Land
89 m2
-Prés
Land
5498 m2
-Sols
Land
266 m2
-Prés
Land
2366 m2
-Prés
Land
71 m2
-Prés
Land
4489 m2
-Sols
Land
1895 m2
-Prés
17 transactions listed in the municipality
Compare with neighboring municipalities
City
name
name
house
Price per m²
Price per m²
apt.
Price per m²
Price per m²
City information
Zip code
- 52240 THOL LES MILLIERES
Data source & update
- Latest publication of the property value request (DVF) database made available by the DGFiP on October 19, 2025, covering transactions up to 06/30/2025:
- Administrative/cadastral division as of September 1, 2025, and municipal movements as of January 1, 2025: