Real estate price map
Real estate price map in the municipality of Doué-en-Anjou, choose a section to see transactions by parcel.
Maine-et-Loire (49)
Price per m² in Doué-en-Anjou
Median price of real estate
in the municipality of Doué-en-Anjou
Houses
1 557 € /m²
Reliability 10/10
Median price on the 30 transactions of the last 3 months.
from 933 to
2 242 € /m²
2 242 € /m²
60% of transactions from the 2nd to the 8th deciles.
Apartments
1 060 € /m²
Reliability 5/10
Median price on the 18 transactions of the last 48 months.
from 940 to
1 216 € /m²
1 216 € /m²
60% of transactions from the 2nd to the 8th deciles.
Dwellings
1 557 € /m²
Reliability 10/10
Median price on the 30 transactions of the last 3 months.
from 933 to
2 242 € /m²
2 242 € /m²
60% of transactions from the 2nd to the 8th deciles.
Evolution of the price per m² of houses since...
1 year
-17%
2 years
-14%
3 years
-2.5%
4 years
+5.4%
5 years
+10%
6 years
+20%
7 years
+20%
8 years
+15%
9 years
+16%
10 years
+25%
11 years
+28%
The price per m² of houses has decreased by 17% since 1 year, but it has increased by 28% in 11 years.
Evolution of the price per m² of apartments since...
1 year
--
2 years
+24%
3 years
+9.3%
4 years
+14%
5 years
--
6 years
+41%
7 years
+26%
8 years
+30%
9 years
--
10 years
+26%
11 years
--
2751 transactions listed in the municipality
Yearly data
Yearly evolution of the median price per m²

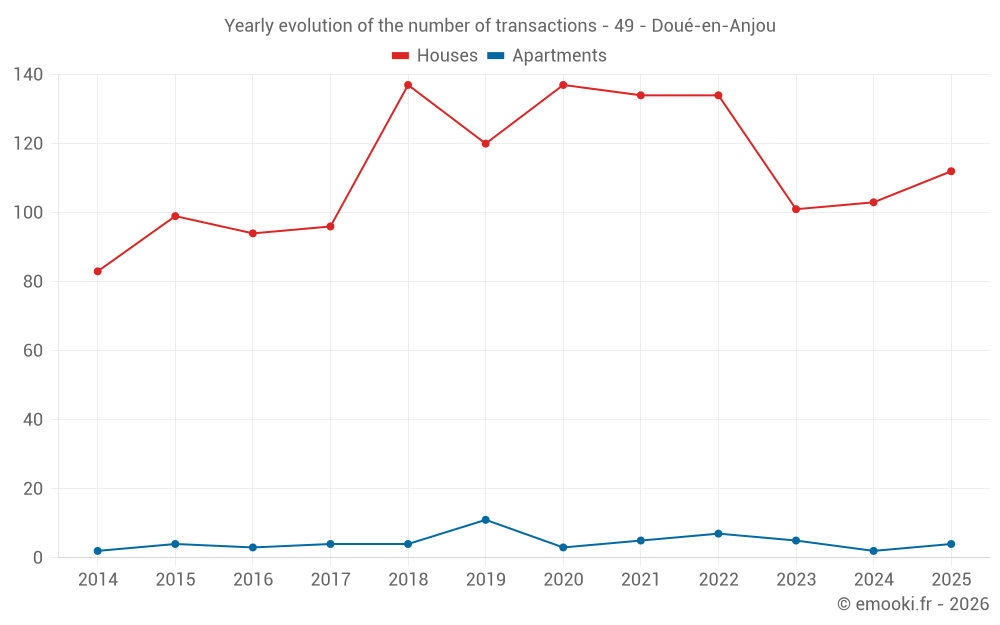
Yearly evolution of the number of transactions
Yearly table
Year
house
transactions
transactions
house
Price per m²
Price per m²
apt.
transactions
transactions
apt.
Price per m²
Price per m²
2025
112
1 518 €
4
1 168 €
2024
103
1 818 €
2
929 €
2023
101
1 761 €
5
941 €
2022
134
1 557 €
7
1 069 €
2021
134
1 440 €
5
1 029 €
2020
137
1 377 €
3
1 356 €
2019
120
1 262 €
11
830 €
2018
137
1 262 €
4
926 €
2017
96
1 320 €
4
896 €
2016
94
1 304 €
3
746 €
2015
99
1 214 €
4
927 €
2014
83
1 188 €
2
930 €
Analysis
Structure of prices per m²
Values of price percentiles per m² over the periods used for the estimated price of each type of property.
Structure of transaction amounts
Values of transaction amounts percentiles over the periods used for the estimated price of each type of property.
Transaction amounts and prices per m² by percentile
Percentile
house
Price per m²
Price per m²
house
Transaction amount
Transaction amount
apt.
Price per m²
Price per m²
apt.
Transaction amount
Transaction amount
10th percentile
617 €
60 000 €
856 €
69 926 €
20th percentile
933 €
97 680 €
940 €
95 400 €
30th percentile
1 106 €
119 K€
1 016 €
124 K€
40th percentile
1 246 €
136 K€
1 034 €
146 K€
50th percentile
1 557 €
150 K€
1 060 €
170 K€
60th percentile
1 755 €
168 K€
1 123 €
190 K€
70th percentile
2 023 €
201 K€
1 190 €
190 K€
80th percentile
2 242 €
252 K€
1 216 €
209 K€
90th percentile
2 613 €
310 K€
1 269 €
259 K€
National and departmental comparison
Evolution of the median price per m² of houses
Evolution of the median price per m² of apartments
Quarterly data
Quarterly evolution of the median price per m²
Quarterly evolution of the number of transactions
Quarterly table
Quarter
house
transactions
transactions
house
Price per m²
Price per m²
apt.
transactions
transactions
apt.
Price per m²
Price per m²
2025 Q4
30
1 557 €
0
--- €
2025 Q3
25
1 682 €
0
--- €
2025 Q2
22
1 464 €
0
--- €
2025 Q1
35
1 724 €
4
1 168 €
2024 Q4
29
1 938 €
1
1 195 €
2024 Q3
27
1 771 €
1
663 €
2024 Q2
24
1 704 €
0
--- €
2024 Q1
23
1 893 €
0
--- €
2023 Q4
20
1 630 €
3
941 €
2023 Q3
19
1 636 €
1
720 €
2023 Q2
36
1 855 €
0
--- €
2023 Q1
26
1 640 €
1
1 268 €
2022 Q4
32
1 678 €
2
992 €
2022 Q3
39
1 509 €
1
1 214 €
2022 Q2
38
1 562 €
2
1 081 €
2022 Q1
25
1 573 €
2
1 160 €
2021 Q4
40
1 446 €
1
1 185 €
2021 Q3
34
1 560 €
1
485 €
2021 Q2
34
1 492 €
0
--- €
2021 Q1
26
1 229 €
3
1 029 €
2020 Q4
45
1 402 €
0
--- €
2020 Q3
33
1 426 €
0
--- €
2020 Q2
33
1 138 €
2
1 221 €
2020 Q1
26
1 340 €
1
1 438 €
2019 Q4
32
1 182 €
4
911 €
2019 Q3
35
1 522 €
2
923 €
2019 Q2
24
1 096 €
3
1 091 €
2019 Q1
29
1 352 €
2
716 €
2018 Q4
34
1 297 €
2
930 €
2018 Q3
38
1 312 €
1
968 €
2018 Q2
31
1 279 €
0
--- €
2018 Q1
34
1 112 €
1
732 €
2017 Q4
25
1 410 €
2
896 €
2017 Q3
34
1 311 €
1
642 €
2017 Q2
24
1 126 €
1
1 000 €
2017 Q1
13
1 375 €
0
--- €
2016 Q4
24
1 272 €
1
746 €
2016 Q3
25
1 478 €
1
856 €
2016 Q2
24
1 188 €
1
602 €
2016 Q1
21
1 305 €
0
--- €
2015 Q4
25
1 111 €
2
1 194 €
2015 Q3
23
1 233 €
1
854 €
2015 Q2
23
1 176 €
1
843 €
2015 Q1
28
1 294 €
0
--- €
2014 Q4
19
1 154 €
0
--- €
2014 Q3
27
962 €
0
--- €
2014 Q2
24
1 334 €
1
1 042 €
2014 Q1
13
1 120 €
1
817 €
Key takeaways
What is the price per m2 of houses in Doué-en-Anjou?
The median price on the 30 house transactions of the last 3 months in the municipality of Doué-en-Anjou was 1 557 € per square meter for a median property value of 150 200 €. Over this period, 60% of transactions were between 933 and 2 242 € per square meter (from the 2nd to the 8th deciles).
Compare with neighboring municipalities
City
name
name
house
Price per m²
Price per m²
apt.
Price per m²
Price per m²
City information
Zip codes
- BRIGNE 49700 DOUE EN ANJOU
- CONCOURSON SUR LAYON 49700 DOUE EN ANJOU
- DOUE LA FONTAINE 49700 DOUE EN ANJOU
- FORGES 49700 DOUE EN ANJOU
- LES VERCHERS SUR LAYON 49700 DOUE EN ANJOU
- MEIGNE 49700 DOUE EN ANJOU
- MONTFORT 49700 DOUE EN ANJOU
- ST GEORGES SUR LAYON 49700 DOUE EN ANJOU