Real estate price map
Real estate price map in the municipality of Mont Lozère et Goulet, choose a section to see transactions by parcel.
Price per m² in Mont Lozère et Goulet
Median price of real estate
in the municipality of Mont Lozère et Goulet
1 244 € /m²
1 410 € /m²
1 350 € /m²
587 transactions listed in the municipality
Yearly data
Yearly evolution of the median price per m²

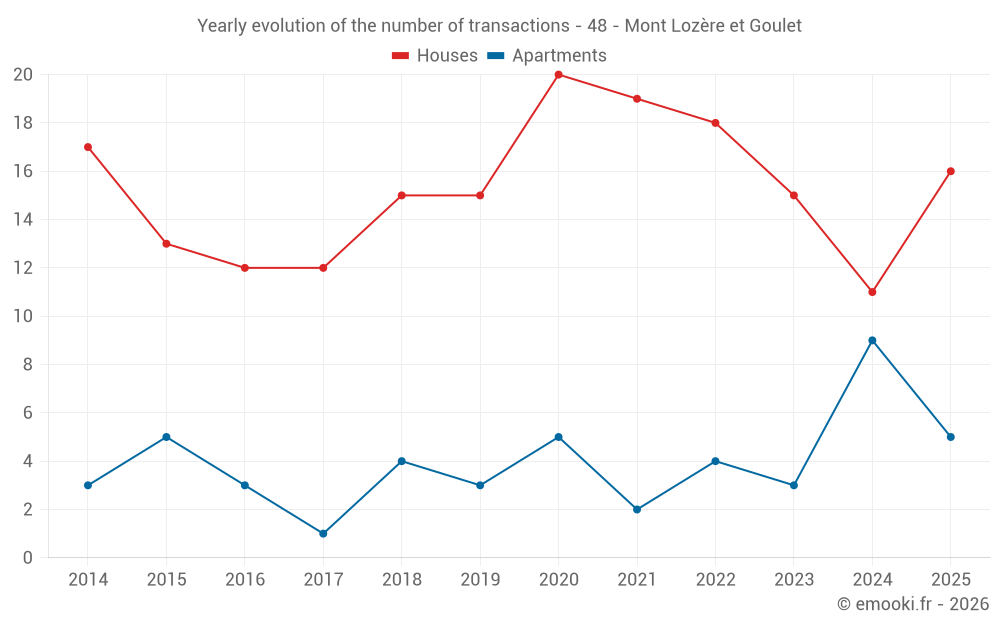
Yearly evolution of the number of transactions
Yearly table
transactions
Price per m²
transactions
Price per m²
Analysis
Structure of prices per m²
Values of price percentiles per m² over the periods used for the estimated price of each type of property.
Structure of transaction amounts
Values of transaction amounts percentiles over the periods used for the estimated price of each type of property.
Transaction amounts and prices per m² by percentile
Price per m²
Transaction amount
Price per m²
Transaction amount
National and departmental comparison
Evolution of the median price per m² of houses
Evolution of the median price per m² of apartments
Quarterly data
Quarterly evolution of the median price per m²
Quarterly evolution of the number of transactions
Quarterly table
transactions
Price per m²
transactions
Price per m²
Key takeaways
What is the price per m2 of houses in Mont Lozère et Goulet?
The median price on the 16 house transactions of the last 12 months in the municipality of Mont Lozère et Goulet was 974 € per square meter for a median property value of 79 500 €. Over this period, 60% of transactions were between 625 and 1 244 € per square meter (from the 2nd to the 8th deciles).
What is the price per m2 of apartments in Mont Lozère et Goulet?
The median price on the 14 apartment transactions of the last 24 months in the municipality of Mont Lozère et Goulet was 1 276 € per square meter for a median property value of 40 900 €. Over this period, 60% of transactions were between 685 and 1 410 € per square meter (from the 2nd to the 8th deciles).
Compare with neighboring municipalities
name
Price per m²
Price per m²
City information
Zip codes
- BELVEZET 48170 MONT LOZERE ET GOULET
- BAGNOLS LES BAINS 48190 MONT LOZERE ET GOULET
- LE BLEYMARD 48190 MONT LOZERE ET GOULET
- MAS D ORCIERES 48190 MONT LOZERE ET GOULET
- ST JULIEN DU TOURNEL 48190 MONT LOZERE ET GOULET
- CHASSERADES 48250 MONT LOZERE ET GOULET