emooki
HomePrice mapTransactions
🇬🇧 English🇫🇷 Français🇩🇪 Deutsch🇪🇸 Español🇮🇹 Italiano

Real estate price map


Real estate price map in the municipality of Mas-Saint-Chély.

Lozère (48)
Mas-Saint-Chély

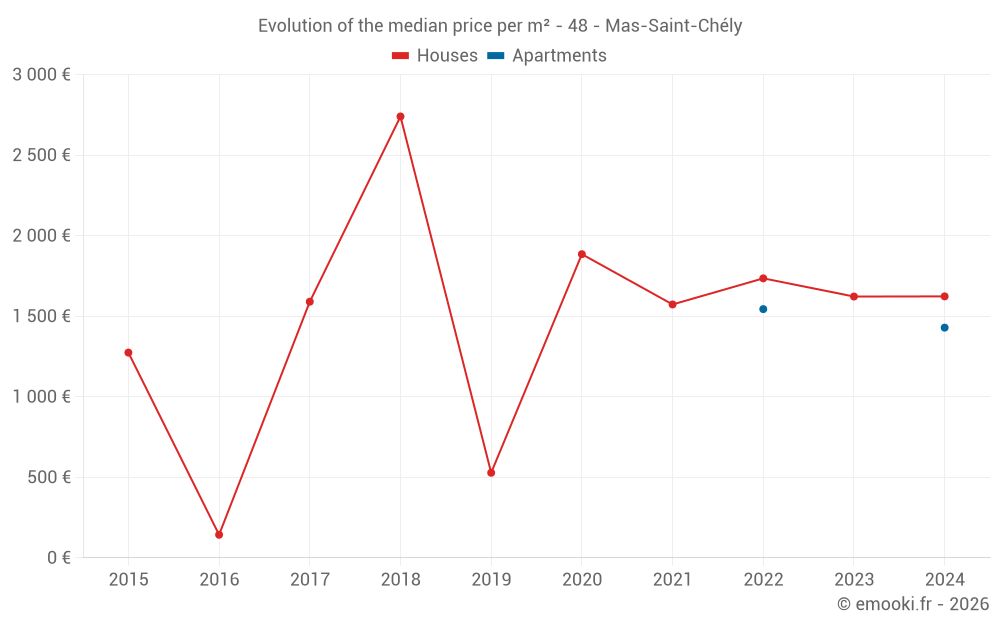
Median price of real estate
in the municipality of Mas-Saint-Chély

HousesHouses
1 600  /m²
1-23-45-67-89-10
Reliability 5/10
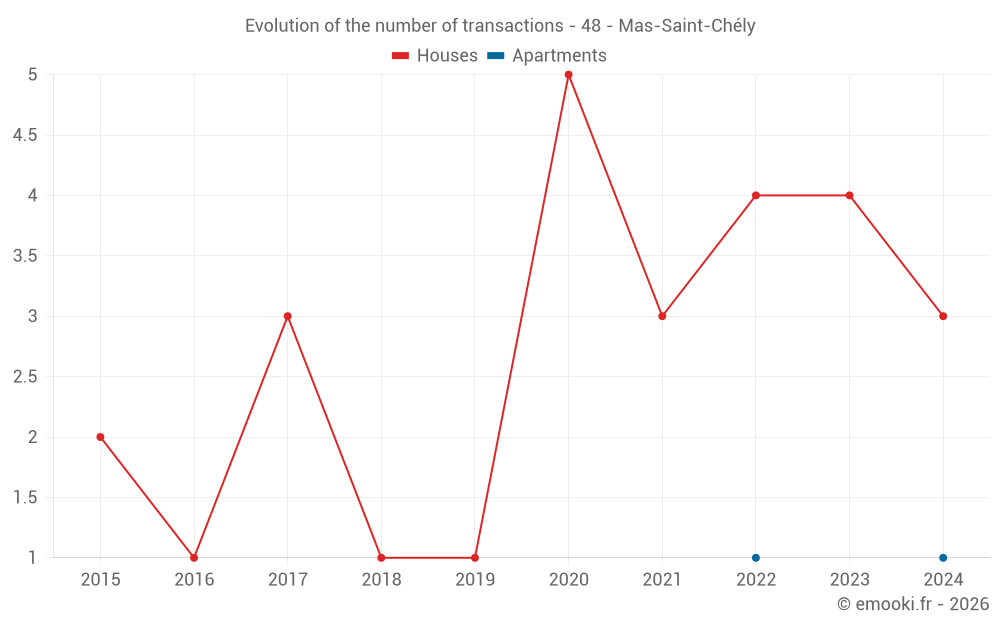
Median price on the 14 transactions of the last 48 months.
from 1 310 to
2 471  /m²
60% of transactions from the 2nd to the 8th deciles.
ApartmentsApartments
1 486  /m²
1-23-45-67-89-10
Reliability 1/10
Median price on the 2 transactions of the last 120 months.
DwellingsDwellings
1 600  /m²
1-23-45-67-89-10
Reliability 6/10
Median price on the 12 transactions of the last 36 months.
from 1 437 to
2 354  /m²
60% of transactions from the 2nd to the 8th deciles.
HousesEvolution of the price per m² of houses since...
1 year
--
2 years
--
3 years
--
4 years
--
5 years
--
6 years
--
7 years
--
8 years
--
9 years
--
10 years
--
11 years
--
ApartmentsEvolution of the price per m² of apartments since...
1 year
--
2 years
--
3 years
--
4 years
--
5 years
--
6 years
--
7 years
--
8 years
--
9 years
--
10 years
--
11 years
--

Yearly evolution

Evolution of the median price per m²

Evolution of the number of transactions

Warning, last year incomplete.

Yearly data

Descending order
Year
Houses
house
transactions
Houses
house
Price per m²
Apartments
apt.
transactions
Apartments
apt.
Price per m²
2025
0
--- 
0
--- 
2024
3
1 623 
1
1 429 
2023
4
1 622 
0
--- 
2022
4
1 735 
1
1 544 
2021
3
1 573 
0
--- 
2020
5
1 885 
0
--- 
2019
1
528 
0
--- 
2018
1
2 740 
0
--- 
2017
3
1 590 
0
--- 
2016
1
143 
0
--- 
2015
2
1 274 
0
--- 
2014
0
--- 
0
--- 

Analysis

Structure of prices per m²

Values of price percentiles per m² over the periods used for the estimated price of each type of property.

Structure of transaction amounts

Values of transaction amounts percentiles over the periods used for the estimated price of each type of property.

Transaction amounts and prices per m² by percentile

Ascending order
Percentile
Houses
house
Price per m²
Houses
house
Transaction amount
Apartments
apt.
Price per m²
Apartments
apt.
Transaction amount
10th percentile
930 
47 100 
1 440 
201 K
20th percentile
1 310 
87 600 
1 452 
202 K
30th percentile
1 465 
98 800 
1 464 
203 K
40th percentile
1 574 
116 K
1 475 
204 K
50th percentile
1 600 
143 K
1 486 
205 K
60th percentile
1 658 
164 K
1 498 
206 K
70th percentile
2 047 
197 K
1 510 
207 K
80th percentile
2 471 
225 K
1 521 
208 K
90th percentile
3 108 
307 K
1 532 
209 K

National and departmental comparison

Evolution of the median price per m² of houses

Evolution of the median price per m² of apartments

Quarterly evolution

Evolution of the median price per m²

Evolution of the number of transactions

Quarterly data

Descending order
Quarter
Houses
house
transactions
Houses
house
Price per m²
Apartments
apt.
transactions
Apartments
apt.
Price per m²
2024 Q4
2
1 650 
0
--- 
2024 Q3
1
1 623 
0
--- 
2024 Q2
0
--- 
1
1 429 
2023 Q4
1
172 
0
--- 
2023 Q3
1
1 667 
0
--- 
2023 Q1
2
2 046 
0
--- 
2022 Q3
3
2 003 
1
1 544 
2022 Q1
1
1 100 
0
--- 
2021 Q4
1
1 573 
0
--- 
2021 Q3
2
2 548 
0
--- 
2020 Q4
2
2 266 
0
--- 
2020 Q2
1
1 885 
0
--- 
2020 Q1
2
2 147 
0
--- 
2019 Q1
1
528 
0
--- 
2018 Q2
1
2 740 
0
--- 
2017 Q3
1
1 590 
0
--- 
2017 Q1
2
2 380 
0
--- 
2016 Q1
1
143 
0
--- 
2015 Q4
2
1 274 
0
--- 

Lozère (48)

Most expensive cities

City
name
Descending orderHouses
house
Price per m²
2 306 
2 116 
2 105 
City
name
Descending orderApartments
apt.
Price per m²
2 572 
1 806 
1 659 
1 603 
1 591 
1 550 
1 542 
1 531 
1 507 

Least expensive cities

City
name
Ascending orderHouses
house
Price per m²
511 
578 
622 
627 
642 
672 
698 
700 
City
name
Ascending orderApartments
apt.
Price per m²
184 
187 
243 
286 
336 
353 
357